• LTC/USD went up from $90.50 to $91 in the early hours of Wednesday.
  • Moving average convergence/divergence (MACD) shows slight bullish momentum.

LTC/USD went up from $90.50 to $91 in the early hours of Wednesday. The four latest sessions are trending in a flag formation. The hourly price chart shows that the price went up to $91.85, where it met resistance and fell to $90.15. After that, it went up again to $91.56, where it met resistance again and fell to $91.

LTC/USD daily chart

fxsoriginal

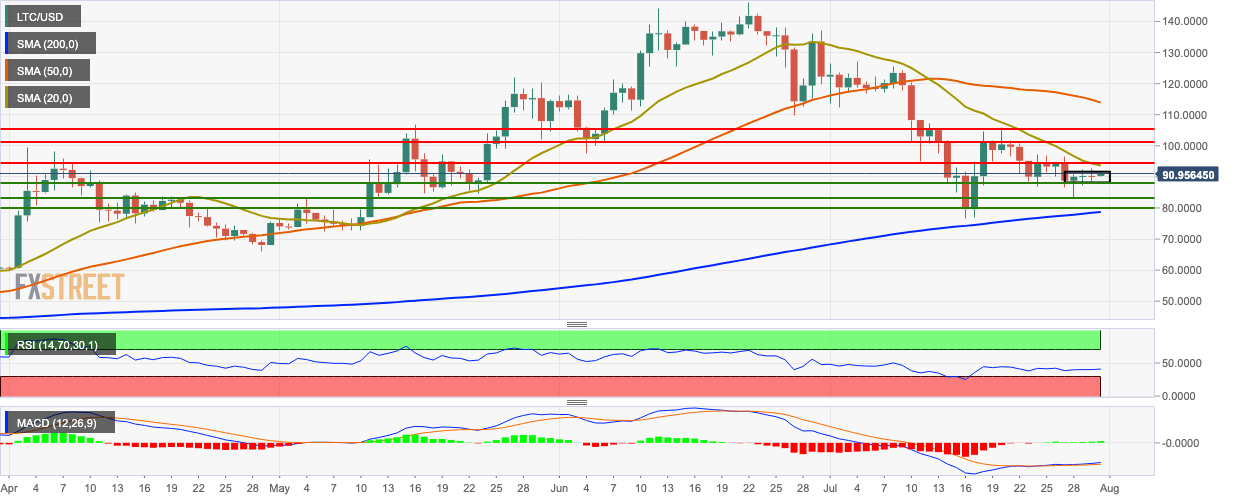
The LTC/USD daily chart is trending below the 50-day simple moving average (SMA 50) and SMA 20 curves. The SMA 20 curve has taken a sharp turn and is trending close to the price. The relative strength index (RSI) indicator is trending around 41.25. The moving average convergence/divergence (MACD) shows slight bullish momentum.


Note: All information on this page is subject to change. The use of this website constitutes acceptance of our user agreement. Please read our privacy policy and legal disclaimer. Opinions expressed at FXstreet.com are those of the individual authors and do not necessarily represent the opinion of FXstreet.com or its management. Risk Disclosure: Trading foreign exchange on margin carries a high level of risk, and may not be suitable for all investors. The high degree of leverage can work against you as well as for you. Before deciding to invest in foreign exchange you should carefully consider your investment objectives, level of experience, and risk appetite. The possibility exists that you could sustain a loss of some or all of your initial investment and therefore you should not invest money that you cannot afford to lose. You should be aware of all the risks associated with foreign exchange trading, and seek advice from an independent financial advisor if you have any doubts.

Join Telegram

Recommended content


Recommended Content

Editors’ Picks

Base attracts Lion’s share of Ethereum deposits among Layer 2 chains, beats Optimism in TVL

Base attracts Lion’s share of Ethereum deposits among Layer 2 chains, beats Optimism in TVL

Base, Coinbase’s Ethereum Layer 2 chain, has noted a spike in inflows to its blockchain this week. Nearly $20 million in Ether flowed into Base since Monday, nearly two times that of Arbitrum and five times as much as Optimism, its competitors in the scaling ecosystem. 

More Cryptocurrencies News

SEC vs. Ripple lawsuit sees redacted filing go public, XRP dips to $0.51

SEC vs. Ripple lawsuit sees redacted filing go public, XRP dips to $0.51

Ripple lawsuit develops further as redacted version of SEC filing goes public. Ripple, SEC and related parties will file motions to seal material from the remedies-related filings by May 13.

More Ripple News

FET suffers 2% decline as whales deposit Fetch.AI tokens to exchanges

FET suffers 2% decline as whales deposit Fetch.AI tokens to exchanges

Fetch.AI (FET) token will be the reserve currency of the Superintelligence Alliance (ASI), a merge of three Artificial Intelligence (AI) projects: Fetch.AI, Ocean protocol and SingularityNET. 

More Cryptocurrencies News

Ethereum resume sideways move as Grayscale files to withdraw Ethereum futures ETF application with the SEC

Ethereum resume sideways move as Grayscale files to withdraw Ethereum futures ETF application with the SEC

Grayscale has withdrawn its 19b-4 application for an Ethereum futures ETF. SEC Chair Gensler says several crypto assets are securities as he waives off ETH classification question.

More Ethereum News

Bitcoin: Should you buy BTC here? Premium

Bitcoin: Should you buy BTC here?

Bitcoin (BTC) price shows signs of a potential reversal but lacks confirmation, which has divided the investor community into two – those who are buying the dips and those who are expecting a further correction.

Read full analysis

BTC

ETH

XRP