- Ethereum price auctions just below a strong resistance level.
- The bulls have forged a 7% ETH rally on the week.
- A retest of the mid-$1,200 zone would make it void of the bullish potential.
Ethereum price shows potential for more upside. As the ETH price rapidly ascends toward significant resistant zones, traders may want to wait for ideal buy signals before entering the market.
Ethereum price aims for $1,400
Ethereum price has investors paying close attention as the decentralized smart-contract token has risen by 7% on the week. On December 14, a bullish trend is displayed on smaller time frames. While optimism entices traders to engage in the market for short-term scalps, ETH price still faces significant resistance above.
Ethereum price currently auctions at $1,338. On December 6, FX'Street's Akash Grimath accurately predicted the recent uptrend spike into the mid $1,300 barrier. According to Akash, the volume profile gaps established in November give ETH the potential to rally as high as $1,545.
A Fibonacci Retracement tool surrounding November's swing high at $1,680 to November's swing low at $1,075 shows the price currently auctioning under the 50% fib level. A flip of the significant resistant zone followed by a brief consolidation should be enough to project the ETH price into higher Fib Targets near the $1,400 zone.
Considering the speed of ETH’s current price action, traders may consider utilizing smaller time frame trading methods like moving average crosses and RSI divergences to mitigate and reduce overall risks.
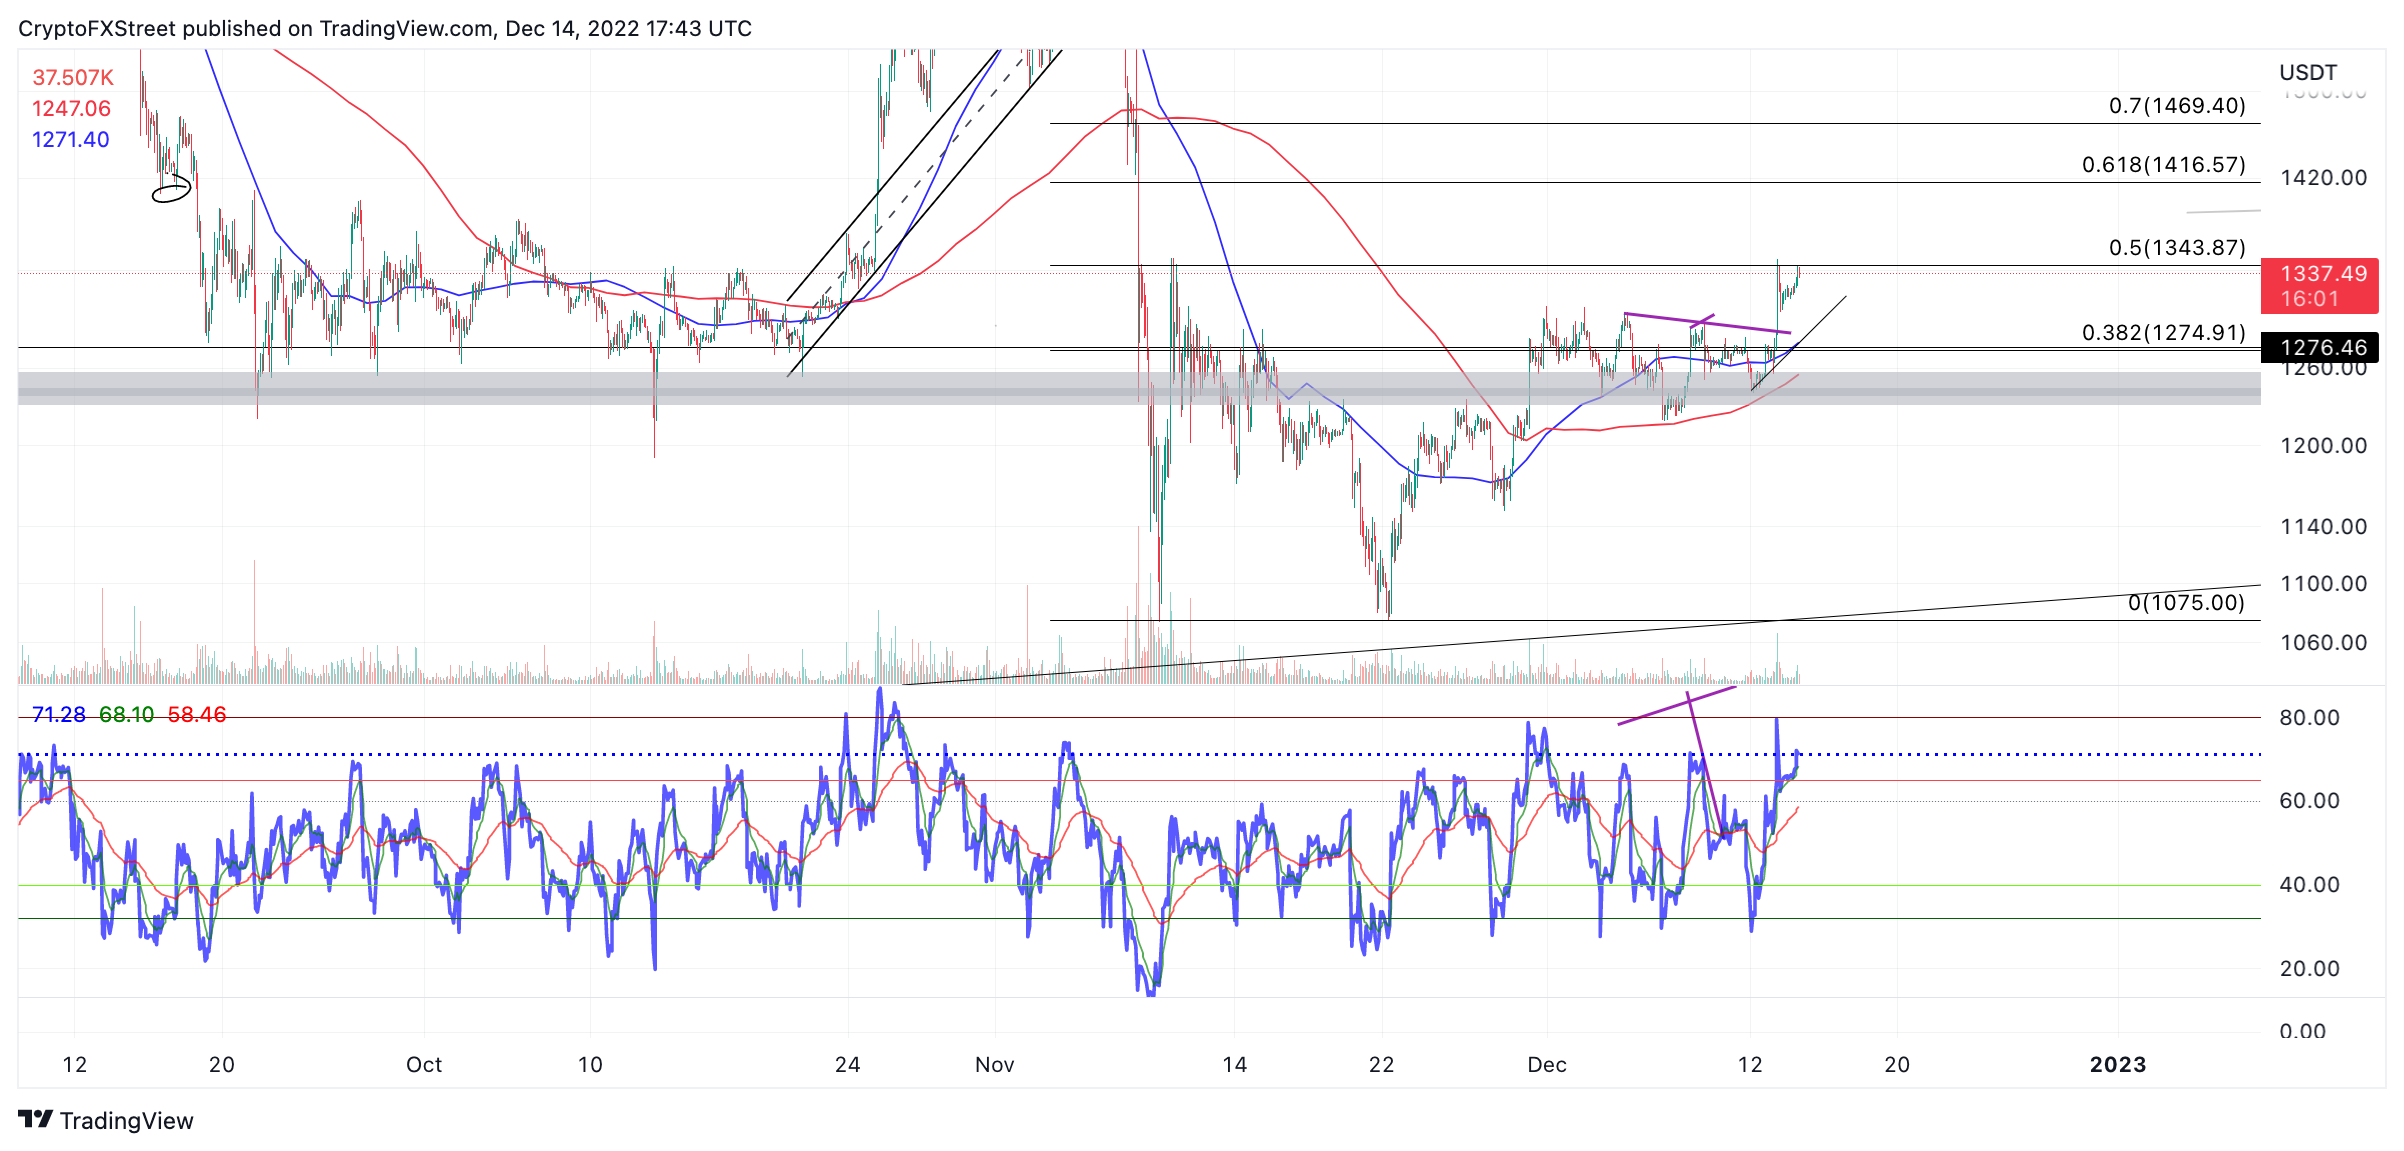
ETH/USDT 2-Hour Chart
At the time of writing, a breach below the Monday low at $1,238 would invalidate the bullish trend. A violation of the low could lead to a retest of the lower half of November's trading range near $1,100. The Ethereum price could decline by 20% if the bearish scenario occurs.
Information on these pages contains forward-looking statements that involve risks and uncertainties. Markets and instruments profiled on this page are for informational purposes only and should not in any way come across as a recommendation to buy or sell in these assets. You should do your own thorough research before making any investment decisions. FXStreet does not in any way guarantee that this information is free from mistakes, errors, or material misstatements. It also does not guarantee that this information is of a timely nature. Investing in Open Markets involves a great deal of risk, including the loss of all or a portion of your investment, as well as emotional distress. All risks, losses and costs associated with investing, including total loss of principal, are your responsibility. The views and opinions expressed in this article are those of the authors and do not necessarily reflect the official policy or position of FXStreet nor its advertisers. The author will not be held responsible for information that is found at the end of links posted on this page.
If not otherwise explicitly mentioned in the body of the article, at the time of writing, the author has no position in any stock mentioned in this article and no business relationship with any company mentioned. The author has not received compensation for writing this article, other than from FXStreet.
FXStreet and the author do not provide personalized recommendations. The author makes no representations as to the accuracy, completeness, or suitability of this information. FXStreet and the author will not be liable for any errors, omissions or any losses, injuries or damages arising from this information and its display or use. Errors and omissions excepted.
The author and FXStreet are not registered investment advisors and nothing in this article is intended to be investment advice.
Recommended Content
Editors’ Picks
Polkadot Price Forecast: DOT confirms trend reversal, eyes retest of $5 after reclaiming key hurdle

Polkadot seems to be ending its downtrend after shedding 92.91% in the last two years from its all-time high of $55.09. In the last three days, DOT has inflated by 3.3%, breaching a declining trendline and confirming the potential start of an uptrend.
Floki Inu Price Forecast: FLOKI sets stage for 30% rally

Floki Inu price rallied nearly 20% on September 30 but closed the candlestick with a 12% gain. The recent uptick opens the possibility of a 30% rally for FLOKI holders. A daily candlestick close below the $0.0000160 level would invalidate the bullish thesis.
Binance Coin Price Prediction: BNB struggles will end after reclaiming $228

Binance Coin (BNB) price has been in a tight consolidation for nearly six weeks. But the range tightening could end soon, potentially allowing bulls to take over and attempt to flip multiple hurdles standing in their way.
Solana Price Forecast: SOL big picture to flip bullish soon, all eyes on $26

Solana (SOL) price seems to be undoing the bearish pressure that has kept it subdued all this time. The recent spike in buying pressure has pushed SOL to produce a higher high on the three-day chart, signaling a shift in momentum favoring bulls.
Bitcoin: BTC recovery rally could be bull trap in disguise, here’s why

Bitcoin (BTC) price remains unfazed even after the multiple spot BTC ETF delays from the US Securities & Exchange Commission (SEC). But investors need to be careful with the ongoing BTC rally as it could be a trap for early bulls.