Is the alt season in jeopardy as Bitcoin slides below $30,000?
- Bitcoin price dropped below the $30,000 psychological level after spending a week above it.
- This sudden collapse has left investors questioning if now is the right time to focus on altcoins.
- A look at the dominance chart shows that the altcoin market share is at a support level and is likely to inflate, while BTC’s market share is likely to decline.

With Bitcoin price sliding below a key psychological level, market participants have started to rethink their bullish views. A close look at the dominance chart reveals that things have stayed the same for altcoins.
Read More: Here are top three altcoin categories that are likely to pump the hardest in the 2023 alt season
Alt season is still in play
Simply put, alt season is when the profits from Bitcoin, Ethereum and/or new capital, flow into altcoins. As a result of this redirection, the dominance of Bitcoin, aka its market share, suffers a decline. Likewise, the altcoin market share increases, giving rise to a phase known as alt season.
Comparing Bitcoin and altcoin dominance helps in forecasting alt season. The chart attached below shows that BTC dominance is facing a hurdle while altcoin dominance is at a support floor.
A bounce off this level seems likely, giving rise to an alt season.
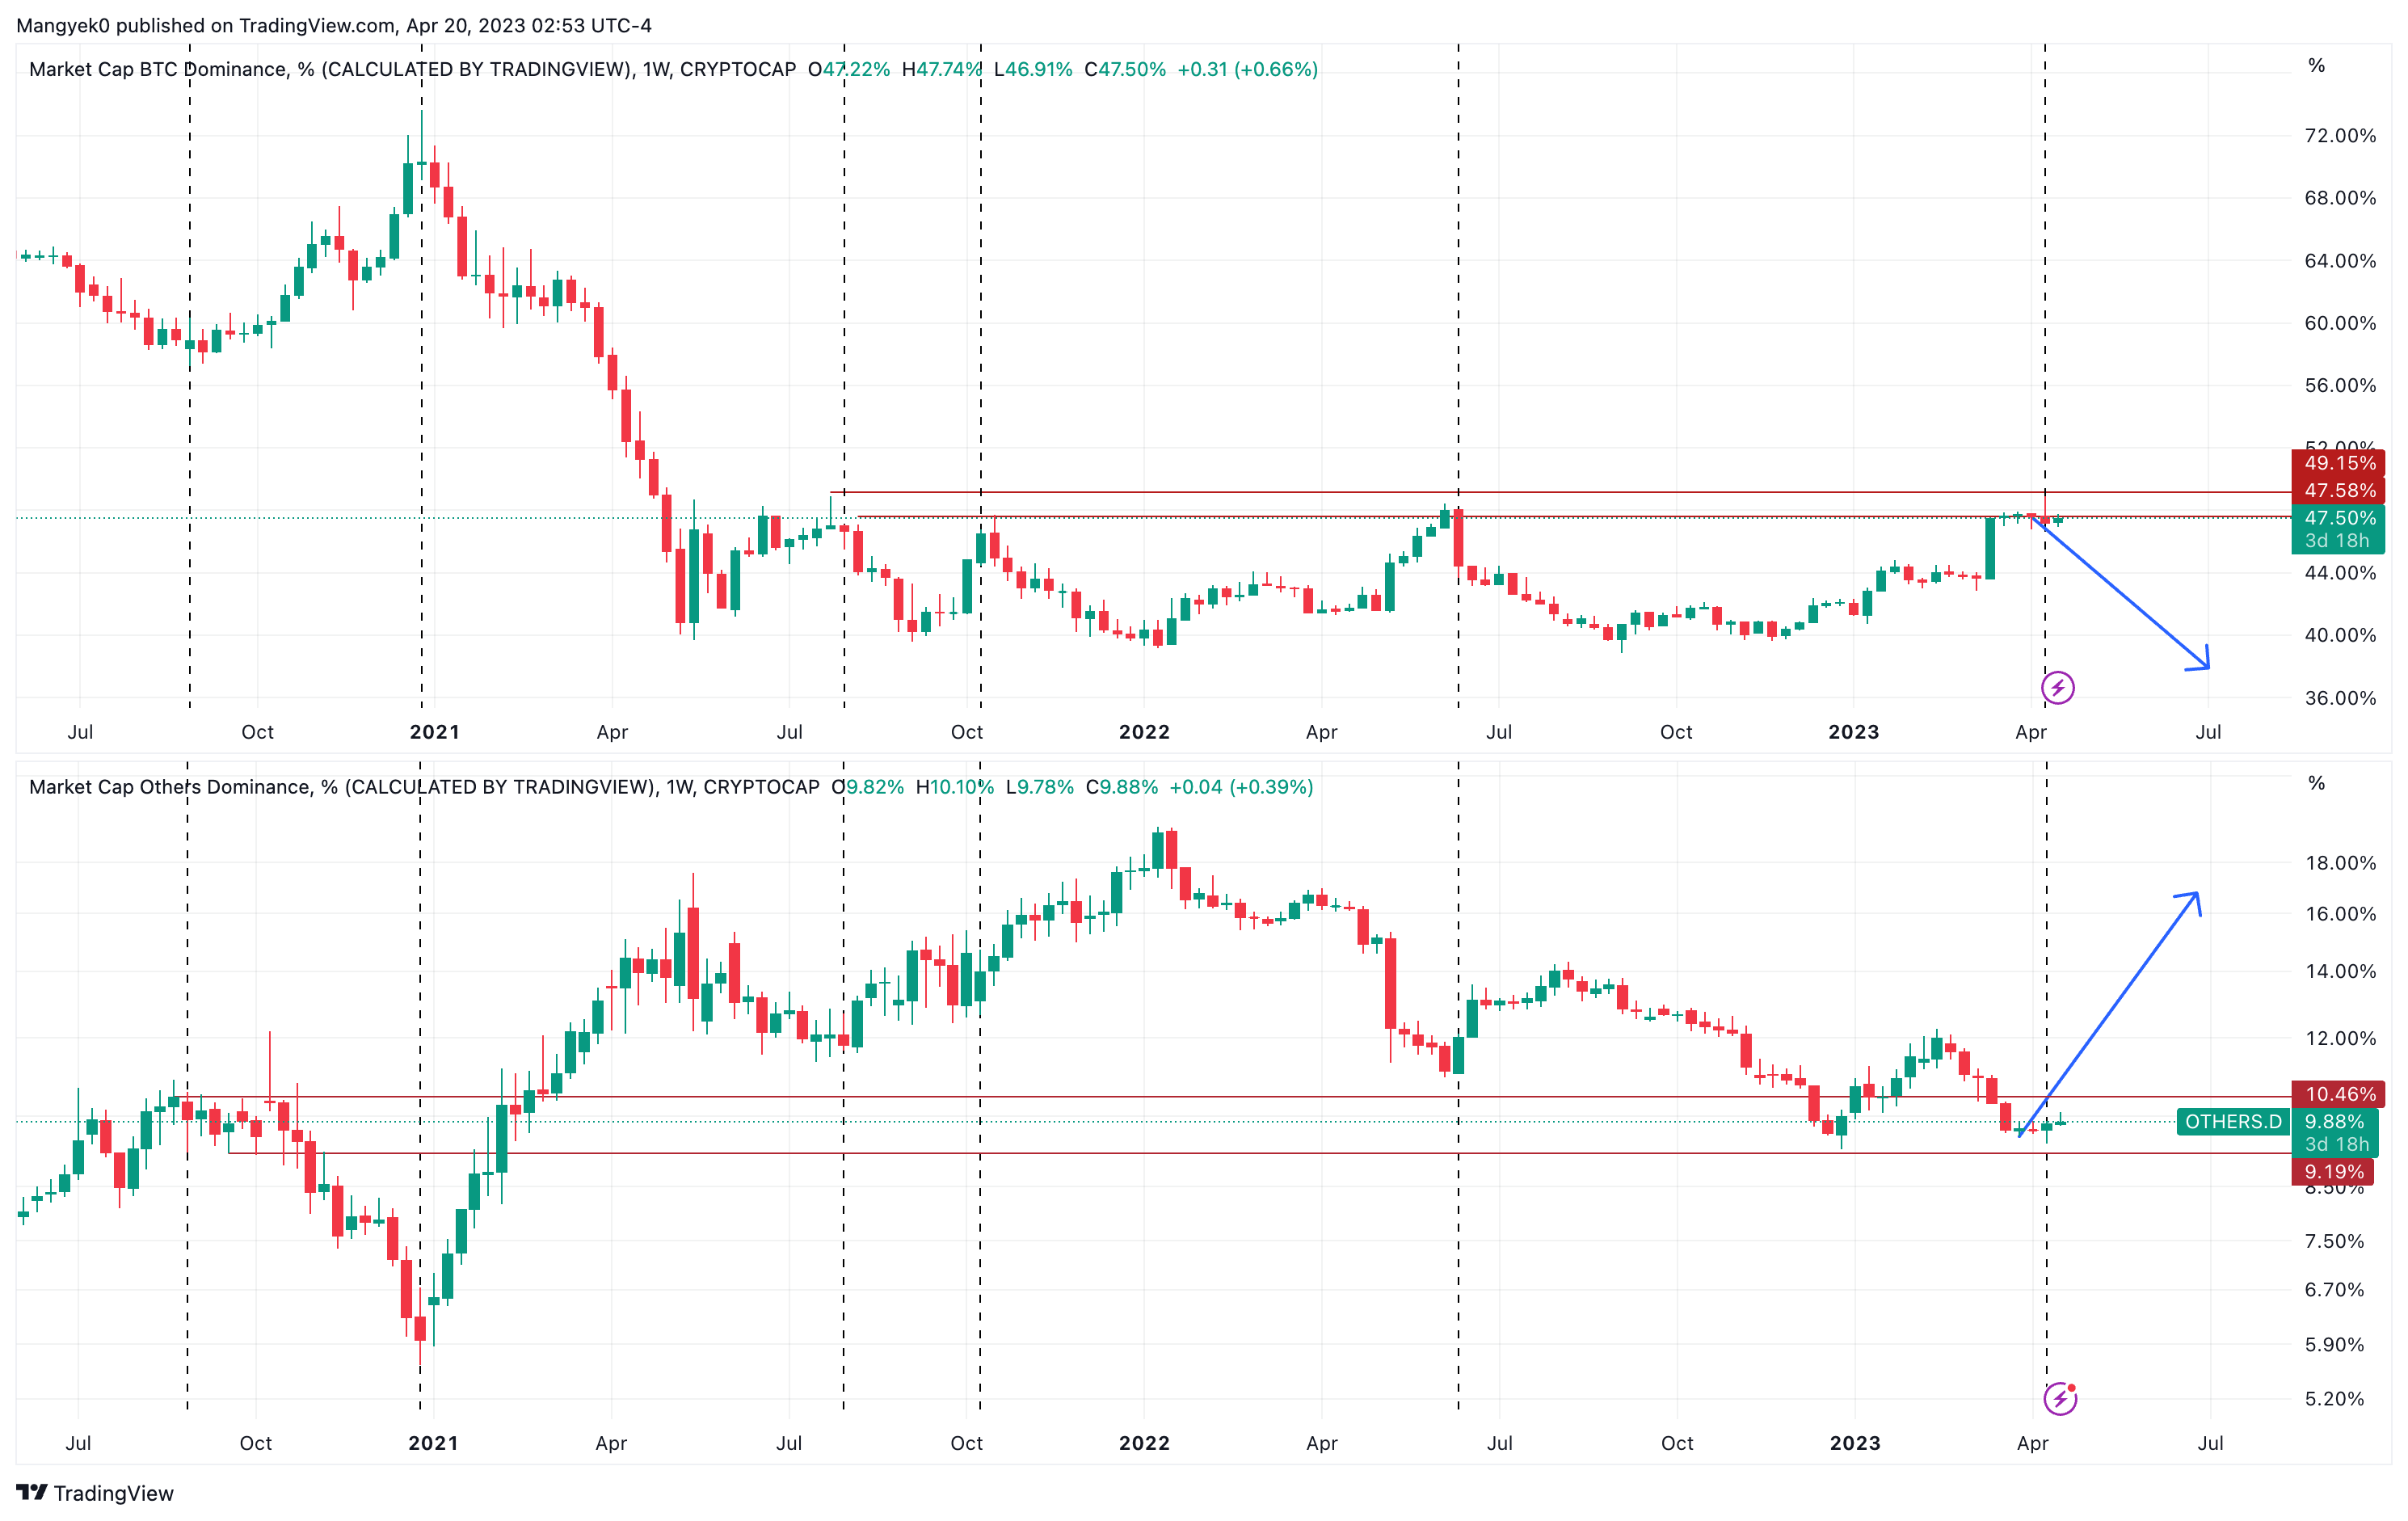
BTC vs. Altcoin dominance chart
Also read: After Arbitrum’s 50% rally, is Optimism (OP) next Layer 2 altcoin to explode?
Bitcoin price plays key role in the next phase for investors
The long-term outlook for Bitcoin price is already facing resistance and selling pressure as it enters the weekly bearish breaker. This breaker setup extends from $29,247 to $41,273, with an inefficiency at roughly the midpoint, stretching from $34,277 to $37,406.
Although BTC has shown incredible performance since the start of 2023, it could continue heading higher, considering the macroeconomic outlook. However, if investors continue to book profits, a retracement to key support levels is likely. If the downtrend does continue, the $25,205 and $24,300 levels are critical for absorbing the selling pressure.
These levels also serve as an accumulation zone.
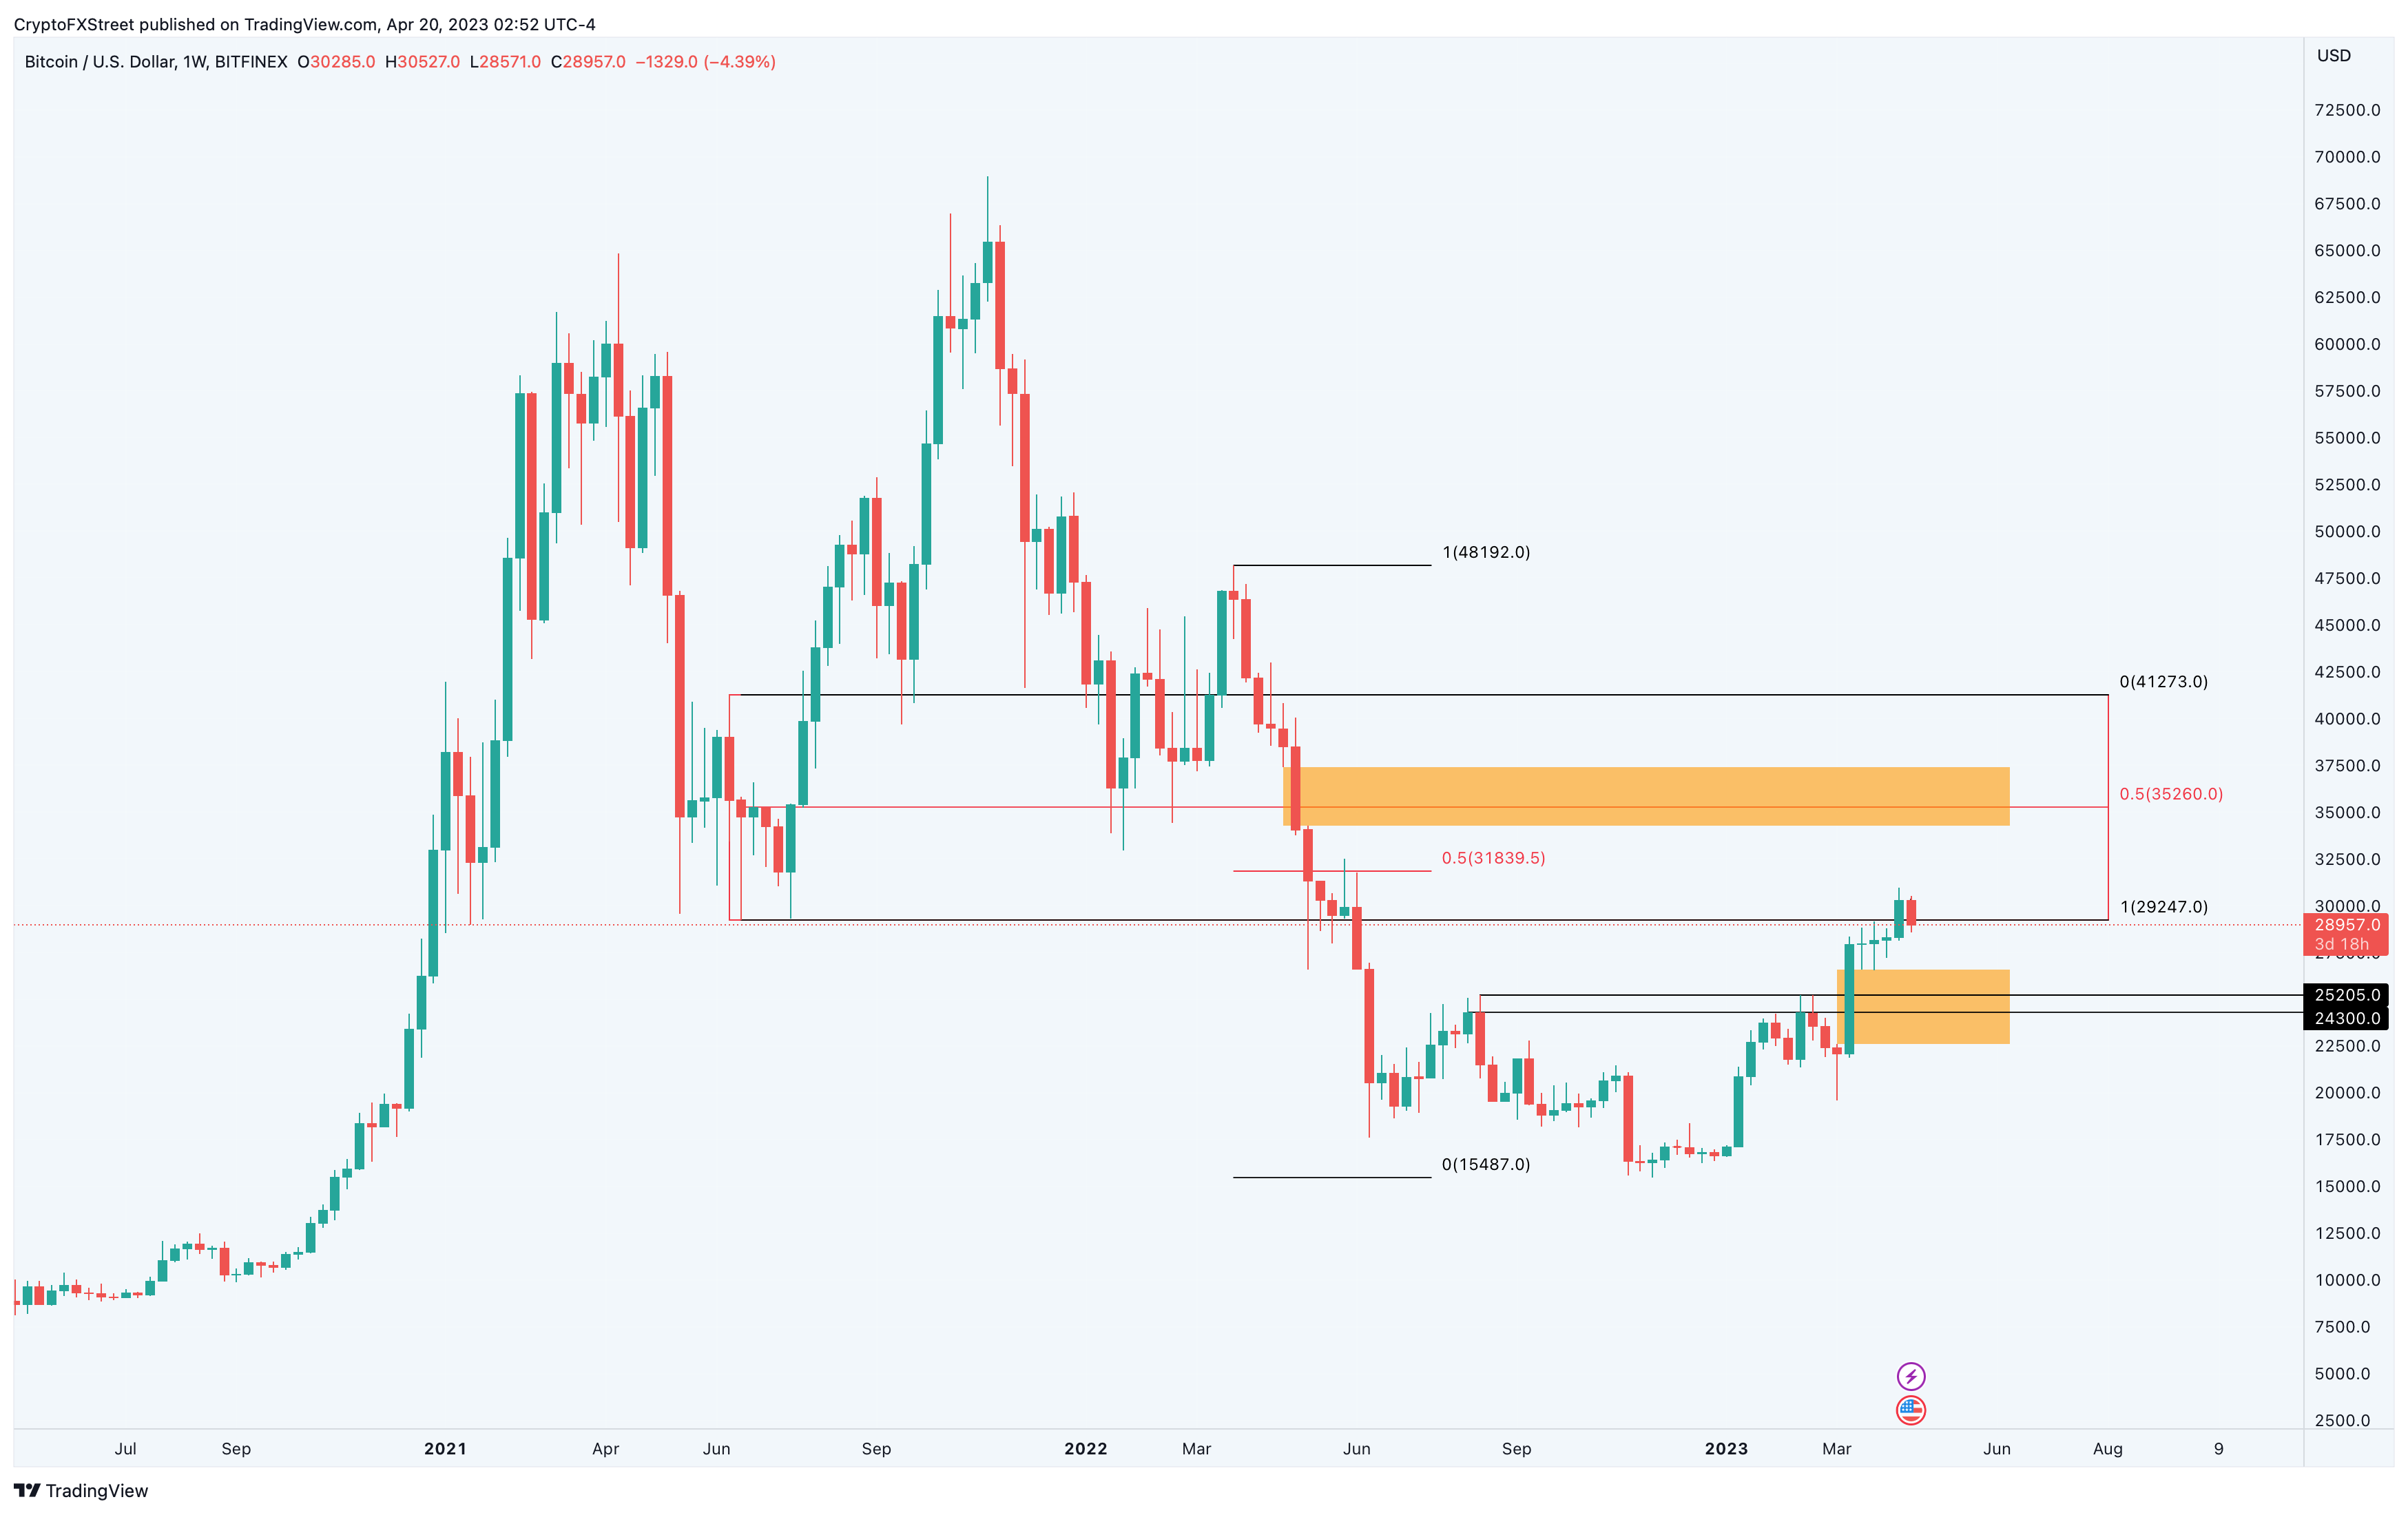
BTC/USDT 1-week chart
Should this move to $24,000 occur quickly and with a massive surge in volatility, the alt season could pause. In such a case, altcoins will try to fight the bearish momentum but could eventually slide lower. Only the strong altcoins could survive and even fewer tokens might rally.
Also read: Bitcoin Price Forecast: Can BTC bears manifest a 30% crash?
Author

Akash Girimath
FXStreet
Akash Girimath is a Mechanical Engineer interested in the chaos of the financial markets. Trying to make sense of this convoluted yet fascinating space, he switched his engineering job to become a crypto reporter and analyst.



