IOTA Price Forecast: IOT regaining ground to $0.3
- IOTA downtrend hits pause at the 200 SMA, shining a light on potential recovery to $0.3.
- IOTA Foundation acknowledges challenges in the implementation of Coordicide, but the launch is still on schedule.

IOTA's bulls are working around the clock, searching for substantial support following a rejection the digital asset encountered marginally under $0.3. Recovery ensued from the support established at $0.23. However, the uptrend targeting $0.30 and $0.4 delayed due to the intensifying bearish grip.
Coordicide launch is within schedule
The IOTA Foundation assured the community in an 'ask me anything' (AMA) session on October 14 that Coordicide, the new protocol will be released as planned. However, the Senior Research Scientist at IOTA, Billy Sanders, highlighted some challenges the team faces concerning implementation.
The challenges lying are implementing and testing our solution. We are implementing our solution into the Pollen testnet and typing it up into our research specifications (the specifications, while not complete, will hopefully be made publicly available soon).
After these tasks are done, our solution will go through a rigorous testing phase. During this time, we will collect performance data, look for attack vectors, and tune the parameters.
Coordicide launch is expected in 2021 and IOTA hopes to bring forth features such as smart contracts, second layer solutions and tokenization. The new protocol will get rid of the Coordinator to increase transaction throughput. IOTA hopes that enterprises and other industry participants will adopt the protocol after the launch in 2021.
IOTA prepares for take-off
IOTA appears to have found short term support at $0.27, which happens to be a descending triangle's horizontal trendline. In technical analysis, descending triangle patterns are usually regarded as bearish because they signal a continuation of the downtrend. However, not all descending triangles lead to bearish scenarios because if robust support comes into the picture, the price action will turn bullish.
IOT/USD 1-hour chart
-637383388224289627.png)
The Relative Strength Index (RSI) suggests that bulls are regaining control and could pull the price higher. Nonetheless, resistance is anticipated at $0.275, the confluence formed by the 50 Simple Moving Average and 100 SMA as well as $0.3.
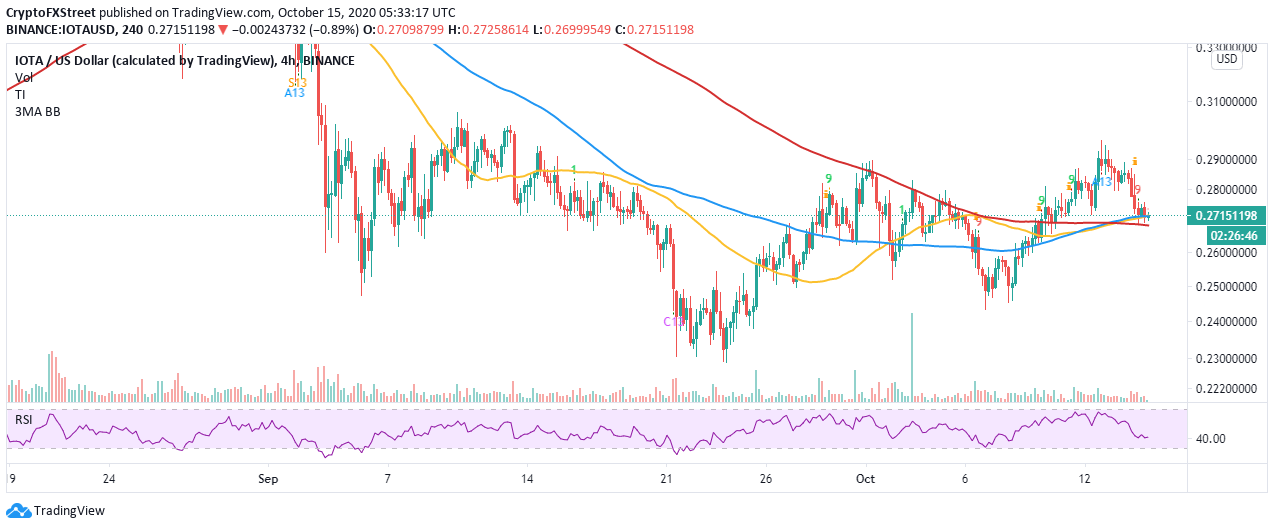
A buy signal presented by the TD Sequential indicator in the form of a red nine candlestick on the 4-hour chart adds credence to the impending recovery. Marginally below the prevailing price, $0.2715, are the 50 SMA and 100 SMA providing support. If the immediate support is shattered, the 200 SMA is in line to stop the losses and place IOTA into a trajectory towards $0.3.
IOT/USD 4-hour chart
Data by Santiment shows that the number of IOTA-related mentions on various social media platforms surged in 24 hours. The increasing chatter surrounding IOTA is attributed to the AMA session. The rise in attention towards the cryptocurrency is a positive indicator for the uptrend likely to resume. While the mentions have not resulted in a massive upswing in IOTA's price yet, they just saved the crypto from plunging further.
IOTA social media mentions chart
 [09.08.34, 15 Oct, 2020]-637383389213376001.png)
Looking at the other side of the fence
It is worth mentioning that IOTA might continue with the downtrend due to the formation of a descending triangle pattern. As mentioned earlier, this pattern is regarded as bearish because it usually signals a downtrend's continuation. Similarly, the buy signal on the 4-hour chart could be invalidated if the price drops below the 200 SMA, therefore, sabotaging the recovery to $0.3. Continued declines are likely to extend towards $0.24, where IOTA will find stout support.
Author

John Isige
FXStreet
John Isige is a seasoned cryptocurrency journalist and markets analyst committed to delivering high-quality, actionable insights tailored to traders, investors, and crypto enthusiasts. He enjoys deep dives into emerging Web3 tren


