- Bitcoin price shows a tight consolidation after the recent 17% crash to $21,283.
- A breakdown of the $20,750 support level could lead to a 15% sell-off to a range low at $17,578.
- However, a sweep of $20,750 followed by a quick recovery could lead to a 12% bounce to $23,175.
Bitcoin price seems to have slid back into consolidation after the recent market sell-off. This development causes uncertainty to spike, leaving investors wondering if they should start buying the dip or taper off on their investments.
Bitcoin price in a suspended state
Bitcoin price faced massive selling pressure at $24,664, aka the midpoint of the $17,578 to $31,749 range. After multiple rejections here, BTC crashed nearly 20% and retested $20,750 for the third time over the last month.
A breakdown of the ongoing consolidation could head in two directions:
- A sweep of the $20,750 level followed by a quick recovery.
- A breakdown of $20,750, leading to a crash that could revisit the June 19 swing low at $17,578.
Investors can assume the first scenario to unfold, considering the upcoming Merge update for the Ethereum blockchain on September 15. The Merge-led rally seems to have caused a lot of altcoins to explode like its bull run.
As the scheduled date approaches, capital could very likely flow from BTC to ETH and other altcoins. This could cause Bitcoin price to consolidate around $20,750 aimlessly. However, if the capital is divided between BTC and ETH, then a quick sweep followed by a recovery seems like a plausible outcome.
The bounce could see Bitcoin price revisit the intermediate resistance level at $22,500. If buyers continue to keep the pressure, an extension of this recovery to $23,175 seems likely and on the cards.
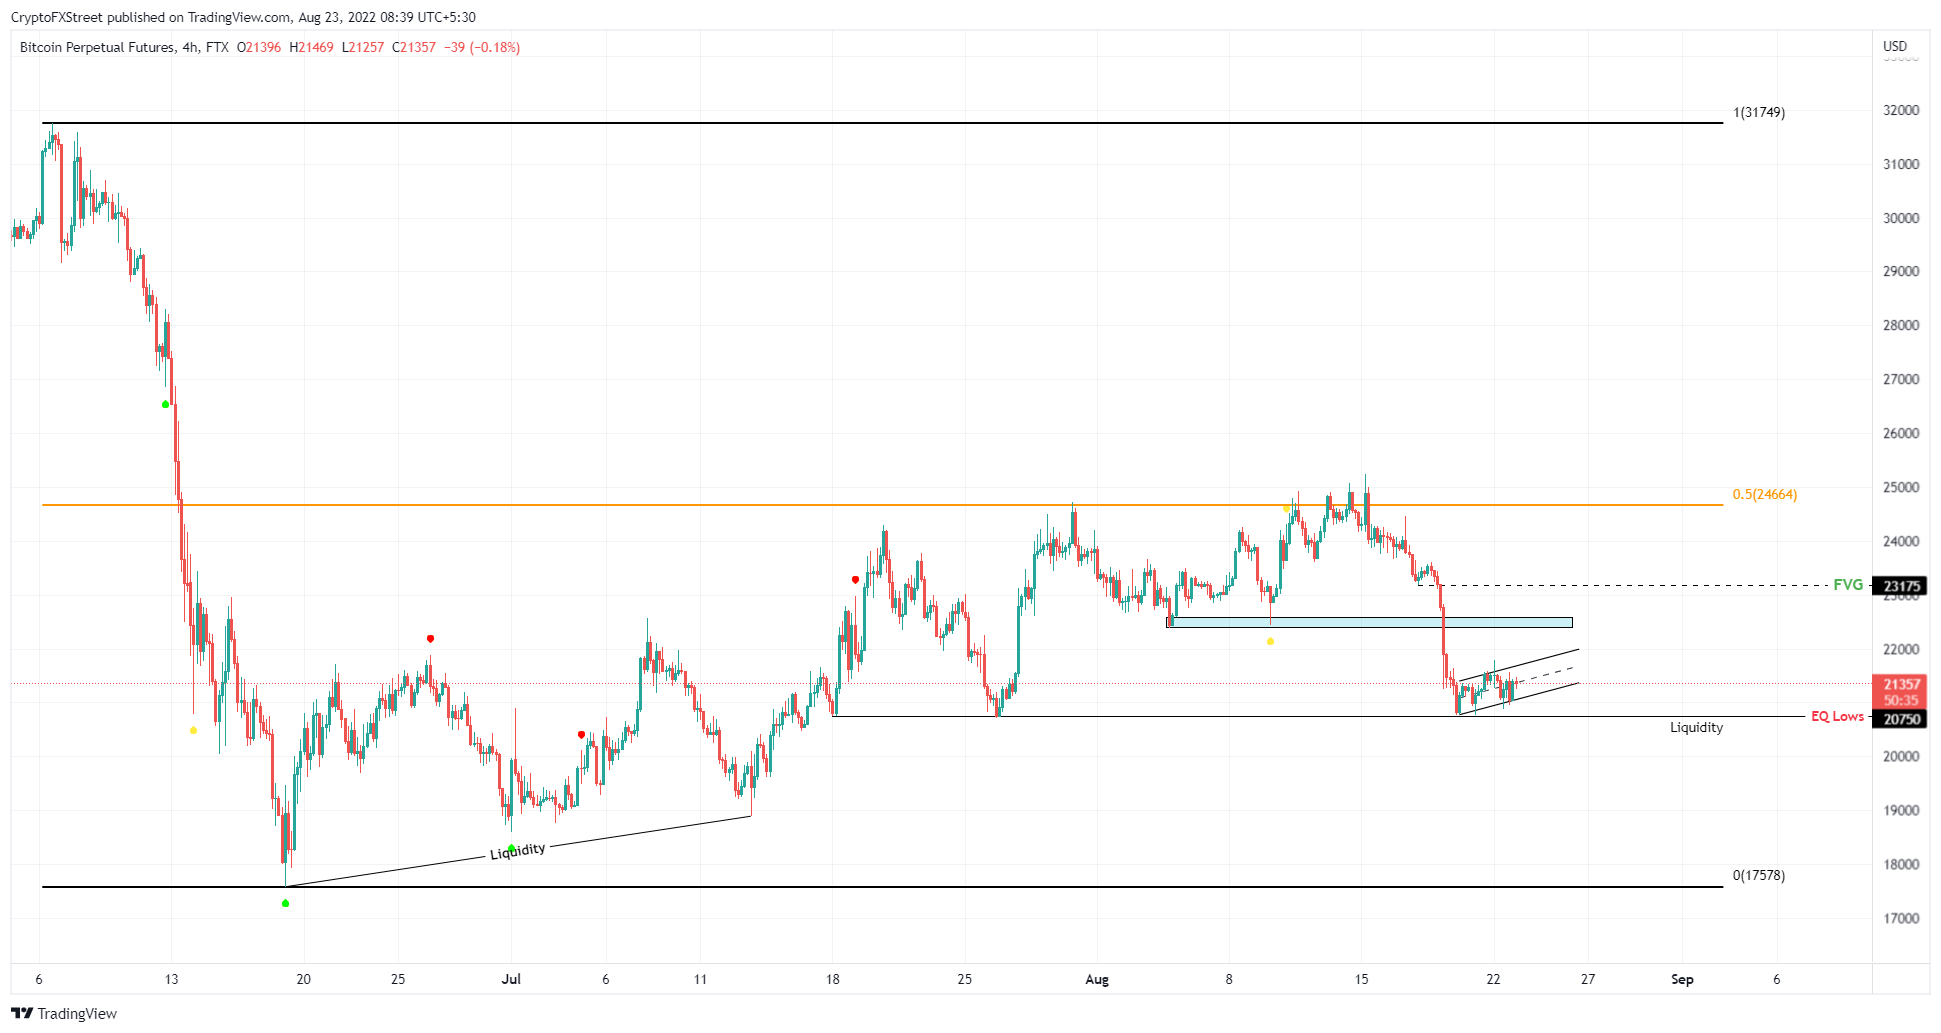
BTC/USDT 4-hour chart
Alternate scenario and its ramifications
However, if Bitcoin price ignores the upcoming Merge and flips the $20,750 support level into a resistance barrier, it will confirm a bearish resurgence. In such a case, let’s take a look at the higher time frame chart.
The daily outlook for BTC shows that it has been consolidating and crashing since the start of 2022. The recent crash has pushed the Point of Control (POC) to $21,177, which is the highest volume traded level since June 10.
A breakdown of this level could result in a 10% drop to roughly $19,000 Even in this bearish outlook, this level is the last point of support for Bitcoin price.
While unlikely to happen in the next few weeks, a breakdown of the aforementioned support area would lead to a catastrophic crash to these support levels - $15,500, $13,500 and $11,900.
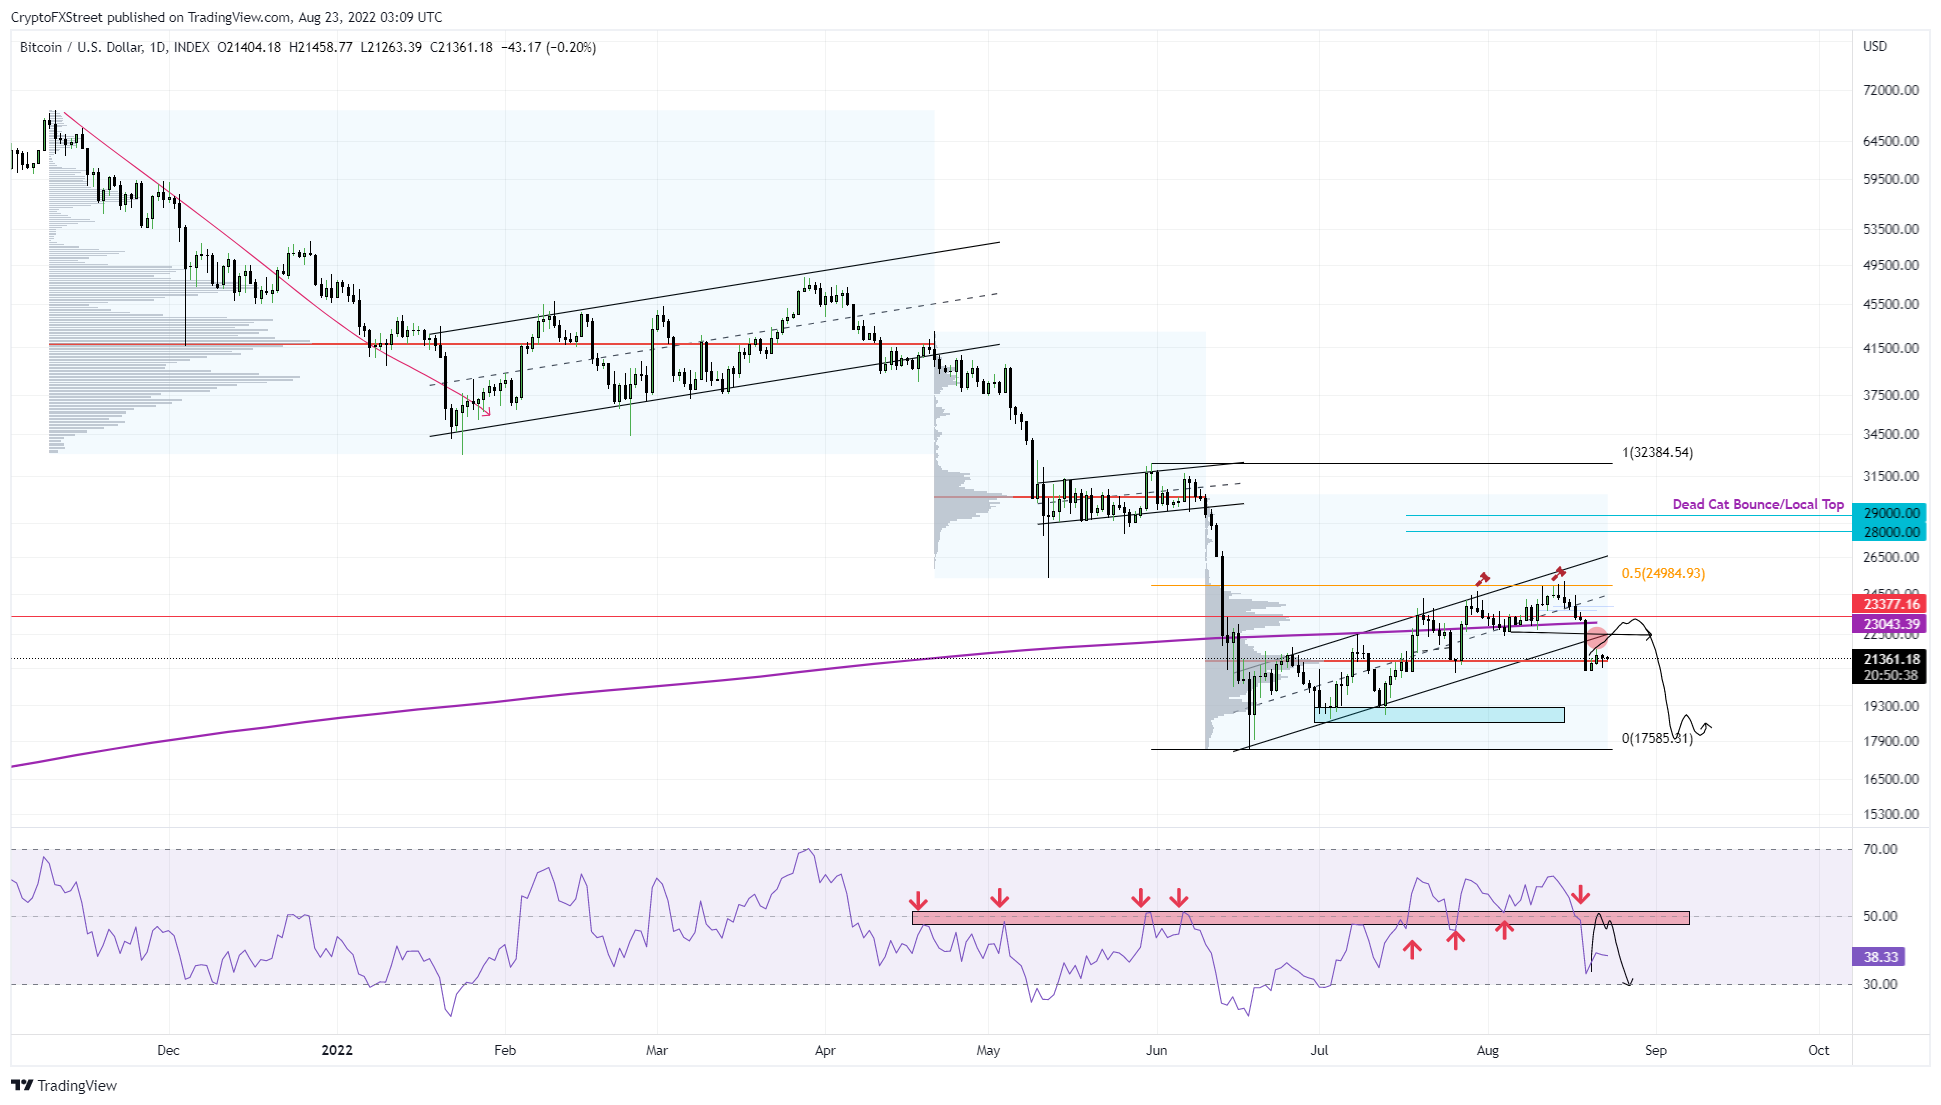
BTC/USD 1-day chart
While these scenarios explained above are mildly bearish to extremely bearish, let’s take look at the bullish outlook for BTC. This narrative will emerge if Bitcoin price rallies from its current position at $21,327 and flip the $25,000 hurdle into a support floor. Such a move will invalidate the beraish theses.
Doing this will indicate that the bulls are back and the 45% crash in the first half of June is ready to be undone. In such a case, BTC needs to clear the previous highs at $32,384 and create a new one.
This development will be the first confirmation of a bull rally. In such a case, market participants need to be on the lookout for a lower low relative to the most recent low at roughly $20,750. If successful, this move will be the one to buy and expect BTC to take off to subsequent resistance levels - $35,000, $45,000 and so on.
Information on these pages contains forward-looking statements that involve risks and uncertainties. Markets and instruments profiled on this page are for informational purposes only and should not in any way come across as a recommendation to buy or sell in these assets. You should do your own thorough research before making any investment decisions. FXStreet does not in any way guarantee that this information is free from mistakes, errors, or material misstatements. It also does not guarantee that this information is of a timely nature. Investing in Open Markets involves a great deal of risk, including the loss of all or a portion of your investment, as well as emotional distress. All risks, losses and costs associated with investing, including total loss of principal, are your responsibility. The views and opinions expressed in this article are those of the authors and do not necessarily reflect the official policy or position of FXStreet nor its advertisers. The author will not be held responsible for information that is found at the end of links posted on this page.
If not otherwise explicitly mentioned in the body of the article, at the time of writing, the author has no position in any stock mentioned in this article and no business relationship with any company mentioned. The author has not received compensation for writing this article, other than from FXStreet.
FXStreet and the author do not provide personalized recommendations. The author makes no representations as to the accuracy, completeness, or suitability of this information. FXStreet and the author will not be liable for any errors, omissions or any losses, injuries or damages arising from this information and its display or use. Errors and omissions excepted.
The author and FXStreet are not registered investment advisors and nothing in this article is intended to be investment advice.
Recommended Content
Editors’ Picks
Could Worldcoin price shoot up 45% ahead of OpenAI’s live stream on Monday?
Worldcoin has formed a double bottom around a key support level, suggesting a potential accumulation. If the OpenAI’s Monday live stream has a positive impact on Artificial Intelligence field, it could positively impact WLD and other AI-based tokens.
Here’s what needs to happen for The Graph price to revisit $0.422

The Graph price trades inside the $0.192 to $0.494 range. Investors need to wait for GRT to overcome $0.343 before being bullish on GRT. If successful, GRT could rally 50% and revisit the $0.422 hurdle. A decisive daily candlestick close below $0.192 will invalidate the bullish thesis.
SingularityNET price could bounce 30% if AGIX can hold this level

SingularityNET price has been consolidating around the bottom of the $0.903 to $1.475 range for nearly a month. With some AI-tokens showing signs of revival, AGIX needs to be enalyzed for potential breakout opportunities like Arkham (ARKM).
Arkham price primed for a recovery rally ahead of OpenAI’s announcement

Arkham price eyes a potential reversal as it clears key hurdles. ARKM likely to rally 27% if it can overcome $2.74 resistance level. A breakdown of $2.28 wil invalidate the bullish thesis for the AI-based token.
Bitcoin: Why BTC is close to a bottom

Bitcoin (BTC) price efforts of a recovery this week have been countered by selling pressure during the onset of the American session. However, the downside potential appears to have been capped. Markets have noted significant trading differences between sessions, and while the Asian market showed strength, whatever ground they were able to cover was oftentimes wiped out by traders in the US.