Bitcoin Weekly Forecast: BTC distribution cycle reaches its first target, here's what to expect next
- Bitcoin price has broken below the 200-week SMA and a significant volume level, hinting at a renewed bearish regime.
- A breakdown of $20,600 is likely to result in a crash to roughly $19,200.
- If BTC manages to flip the $25,000 barrier into a resistance level, it will invalidate the bearish thesis.

Bitcoin price has kick-started a period of controlled selling and is currently approaching short-term support levels. A minor relief rally might occur – before the next leg down to inefficiencies and liquidity. Investors need to be cautious since the current down move has broken significant levels that could trigger a massive sell-off in the future.
This article takes a top-down approach to where BTC could be heading next.
Bitcoin price in a tumble
Bitcoin price has been in a downtrend since its rejection at the $24,989 level. The volume profile between June 10 and August 19 shows that the highest traded level, aka Point of Control (PoC) – a key support and resistance level on the chart – has now shifted to $23,377.
This development indicates that a lot of capital came into the market after a brief move above the 200-week SMA. Yet now sellers seem to be triumphant after the breakdown of the PoC, as well as the 30-day Exponential Moving Average (EMA) at $23,226 and the 200-day Simple Moving Average (SMA) at $22,968.
This triple breakdown is a significantly bearish development and does not bode well for upcoming events.
BTC price has moved to the lower limit of its ascending parallel channel in search of support. The volume profile shows the possibility price could completely slice through the bottom of the channel and retest a support area, extending from $21,300 to $20,300.
Bears are likely to push Bitcoin price down to this level before taking a short break. From a price action standpoint, $19,248 represents a stable support level which extends to $18,608.
So, from the perspective of a short-to-mid-term outlook, investors can expect a 15% crash, especially if the ascending parallel channel breaks down at $22,160.
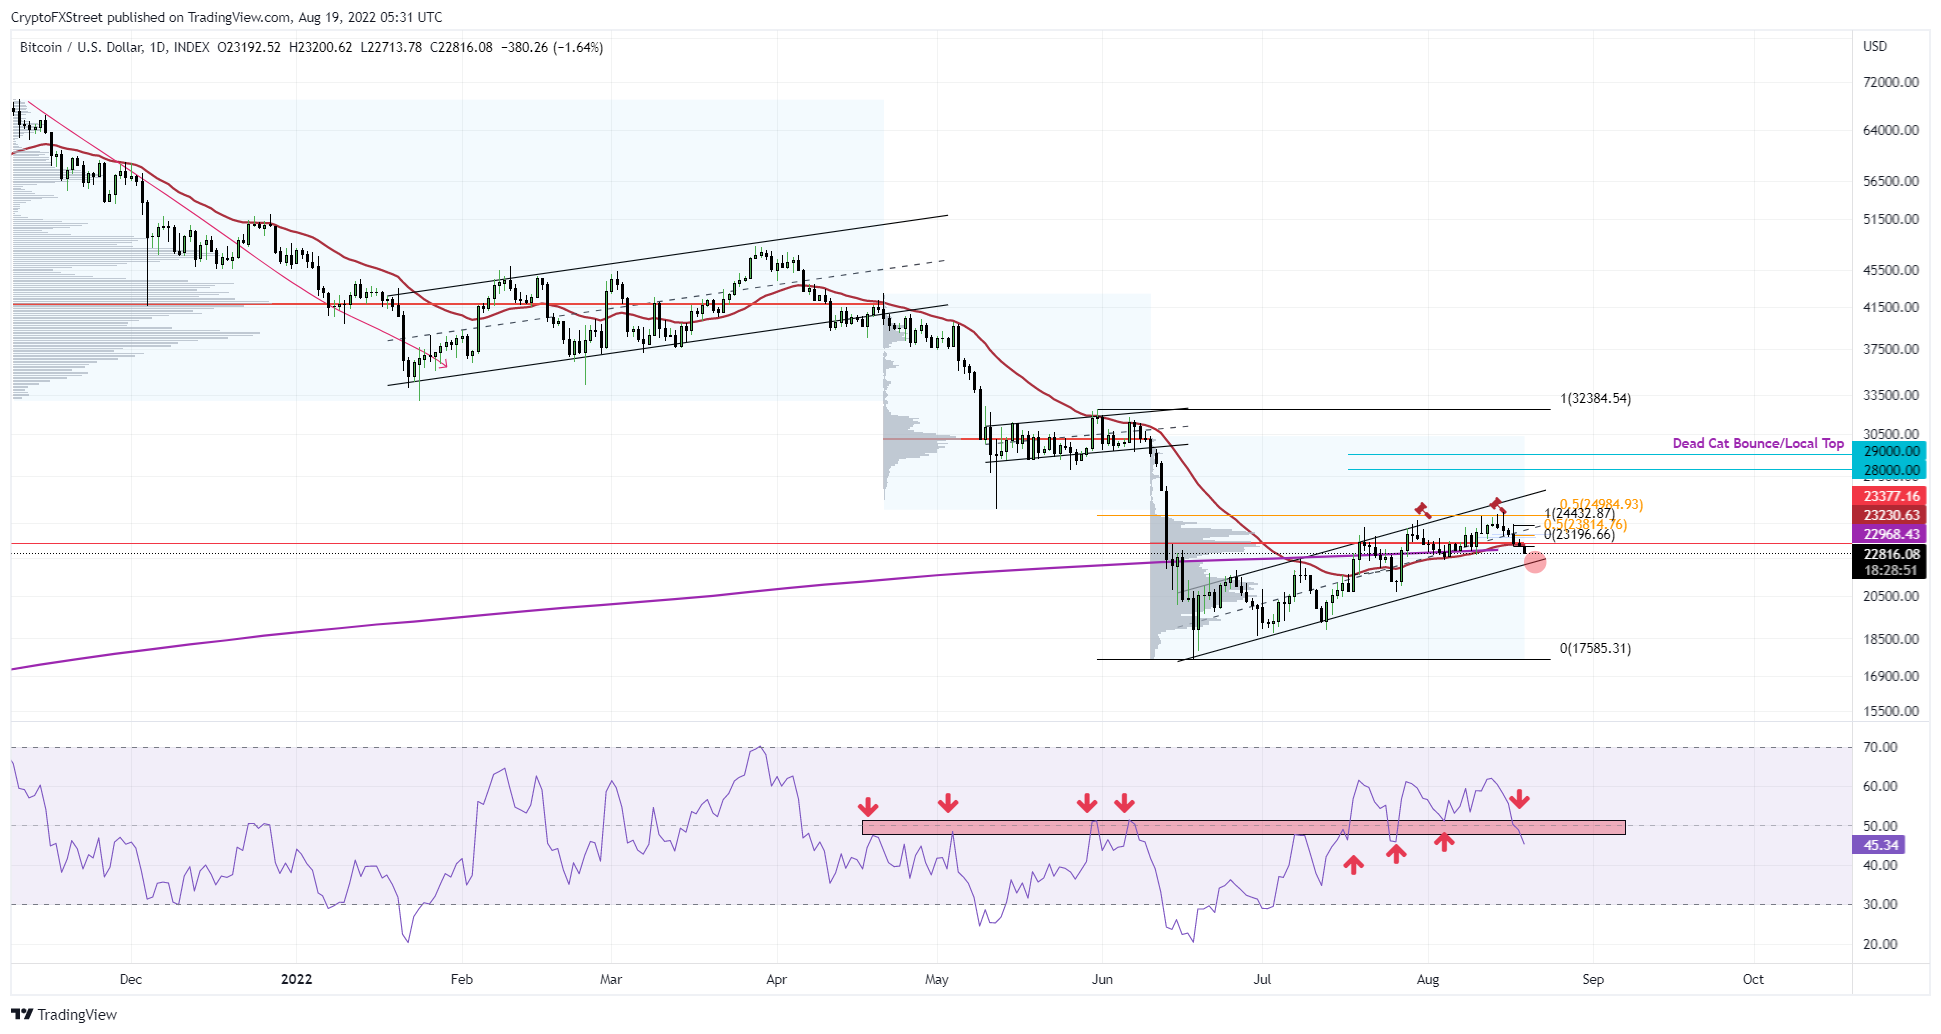
BTC/USDT 1-day chart
On the four-hour chart, Bitcoin price is in the second leg of its distribution phase, where it is developing the last point of supply zones and is heading toward the support levels at $22,600 and $22,382.
Beyond these short-term support structures, Bitcoin price will aim to fill the price inefficiency aka Fair Value Gap (FVG) at $21,140 and potentially sweep the equal lows at $20,750.
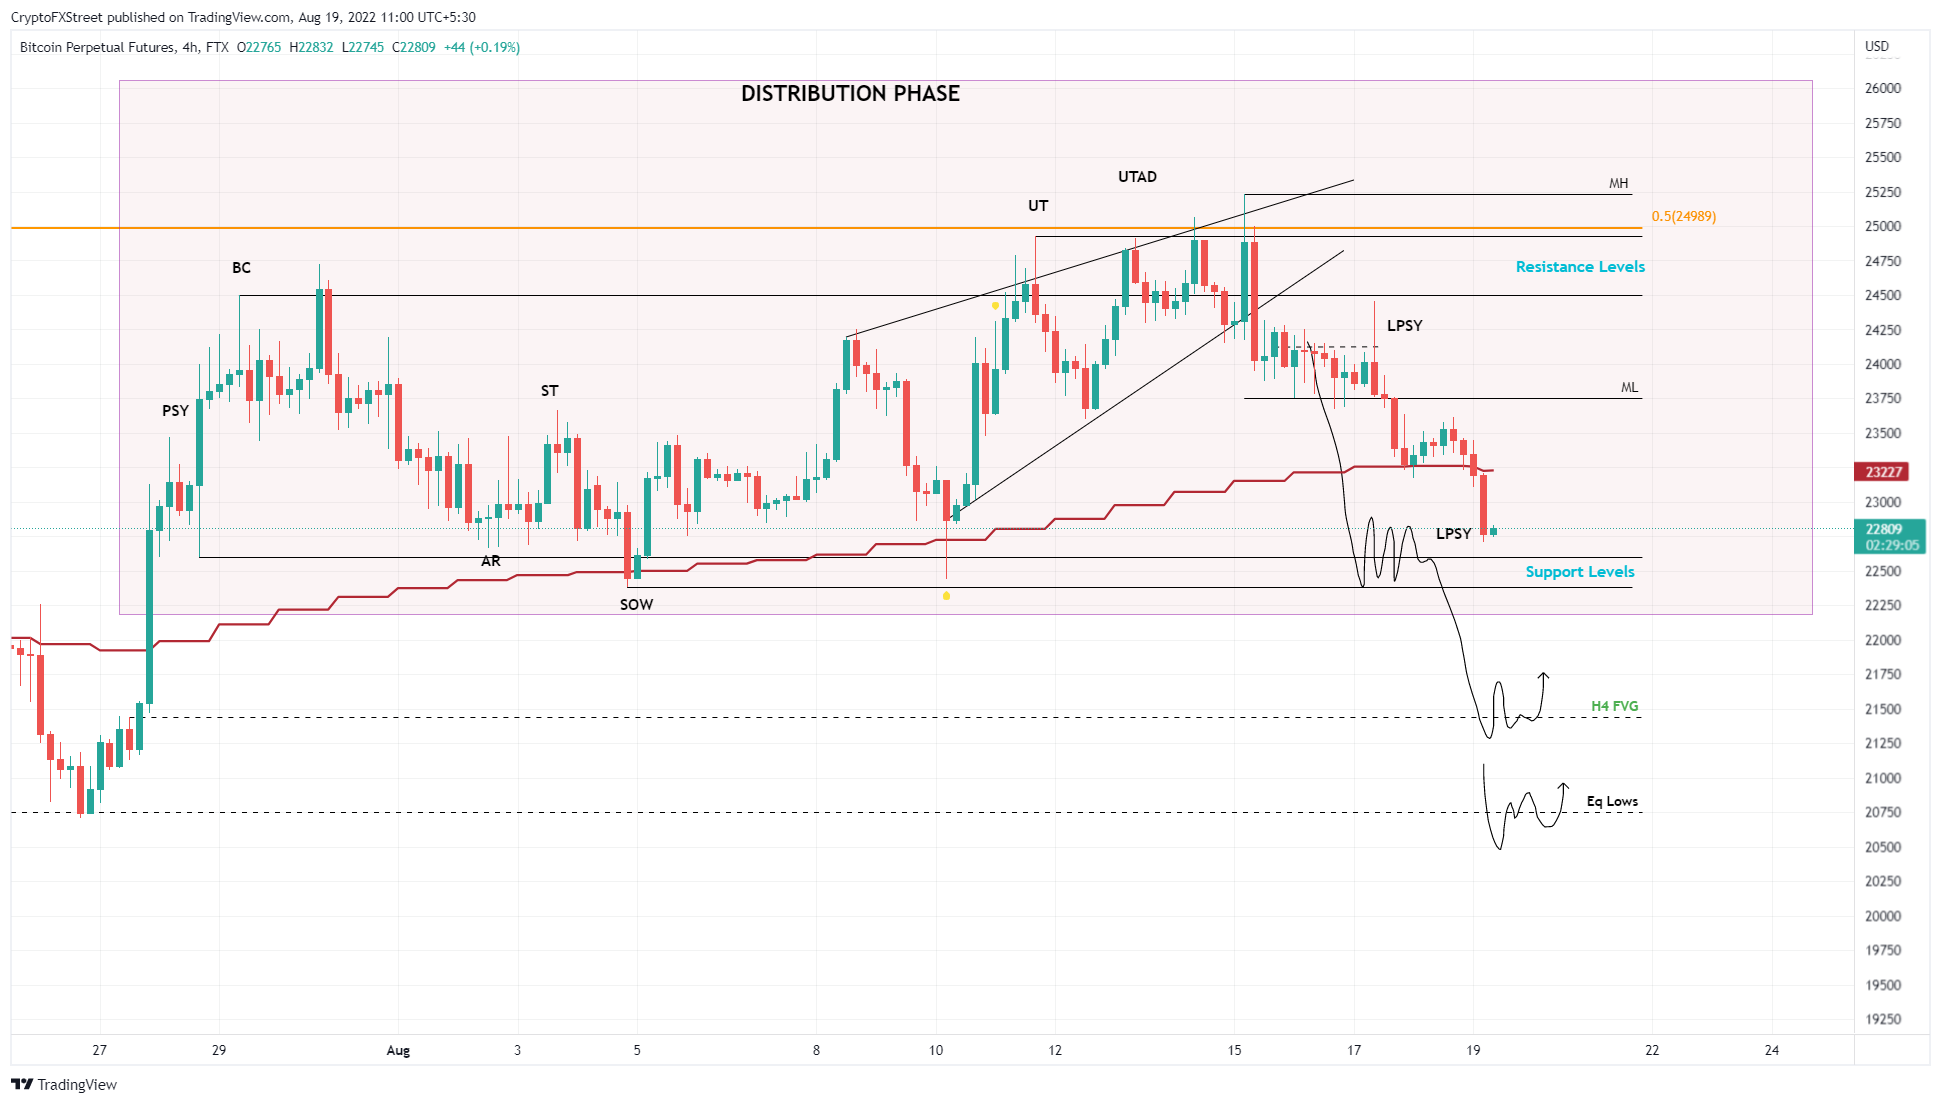
BTC/USDT 4-hour chart
A quick look at IntoTheBlock’s Global In/Out of the Money (GIOM) model shows that the 2.6 million addresses that purchased roughly 1.54 million BTC are “At the Money.” Roughly two days ago, these investors were “In the Money” and were expected to cushion any sell-offs.
These addresses have purchased BTC at an average price of $20,366. So a breakdown of this level, which coincides with the technical forecasts, could result in a steep correction to $12,000 for BTC, as holders jettison their losing positions.
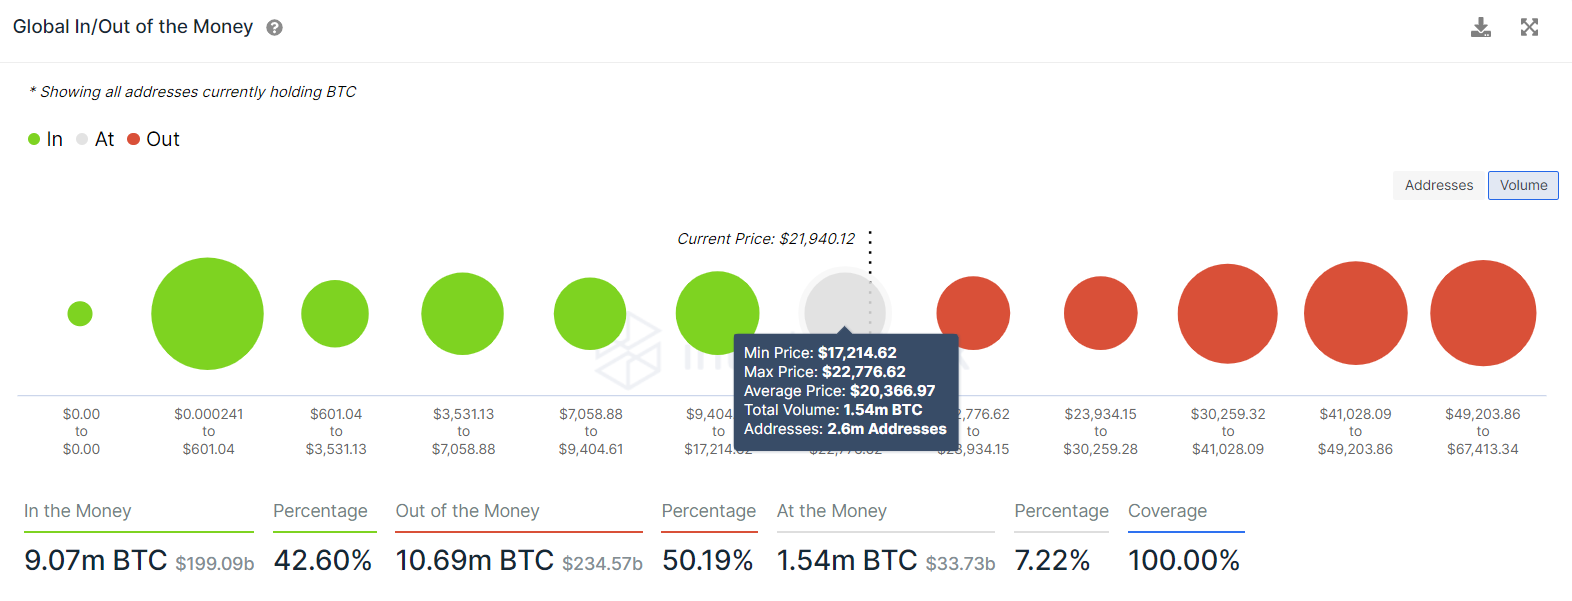
BTC GIOM
While things are looking awfully grim for Bitcoin price, the only way for bulls to invalidate the bearish outlook is if they can flip the $25,000 hurdle into a support level. This move will allow bulls a chance to muster at a price floor and then propel BTC to a new local high, ranging from $28,000 to $29,000.
Author

Akash Girimath
FXStreet
Akash Girimath is a Mechanical Engineer interested in the chaos of the financial markets. Trying to make sense of this convoluted yet fascinating space, he switched his engineering job to become a crypto reporter and analyst.


