- Injective price remains well below the mid-range of the market with a prevailing bearish outlook.
- Outside the Fibonacci Retracement Golden Zone, INJ must rise at least 30% before bulls find it attractive to buy.
- More than 5.9 million INJ tokens have been burned to date, 10,000 recently, but price fails to recover.
Injective (INJ) price is trading with a bearish bias, stuck in the lower section of the market range. The bearish outlook abounds despite the network's deflationary efforts to pump the price. Coupled with broader market gloom, INJ token’s doomed days may not be over yet.
Also Read: Injective could extend gains with 99% approval on upgrade proposal to reduce inflation
Injective price fails to recover despite deflationary interventions
Injective price continues to show weakness despite a recent 10,000 INJ token burn, which has brought the cumulative burning to over 5.9 million tokens.
Over 10,000 $INJ were burned today with over 5.9 Million INJ burned to date
— Injective (@injective) April 24, 2024
Token burning is a deflationary intervention where a certain amount of cryptocurrency tokens are permanently removed from circulation. This can have various implications and benefits for a project and its token holders.
For starters, reducing the total supply of tokens through burning effectively causes scarcity of the remaining tokens to increase. This can potentially lead to an increase in demand for the token, driving up its value.
Nevertheless, the impact of token burning on the Injective price appears to be delayed as bulls wait to buy INJ above the $33.08 price range.
Injective price may have further downside incoming, unless the bulls can haul it by around 30% to an area where bullish activity abounds. This is shown by the yellow shade on the volume indicator, around the mid-section of the Fibonacci Golden Zone, between 61.8% and 50% Fibonacci levels.
The Fibonacci Golden Zone is a key area in price charts that signals potential stabilization or reversal points after significant market movements, with the 61.8% and 50% levels forming the crucial Golden Zone.
Injective Price Outlook: Bulls to buy INJ above $33.08
With the Relative Strength Index (RSI) still below the 50 mean level, subdued and recording lower highs, Injective price could extend the fall. The Moving Average Convergence Divergence (MACD) reinforces this as the momentum indicator remains in negative territory. A bearish cycle may be in the works unless bullish effort increases.
A further downside would otherwise seem likely for Injective price even as INJ bulls try to defend the current position, seen with the small spikes on the volume profile adjacent to the price.
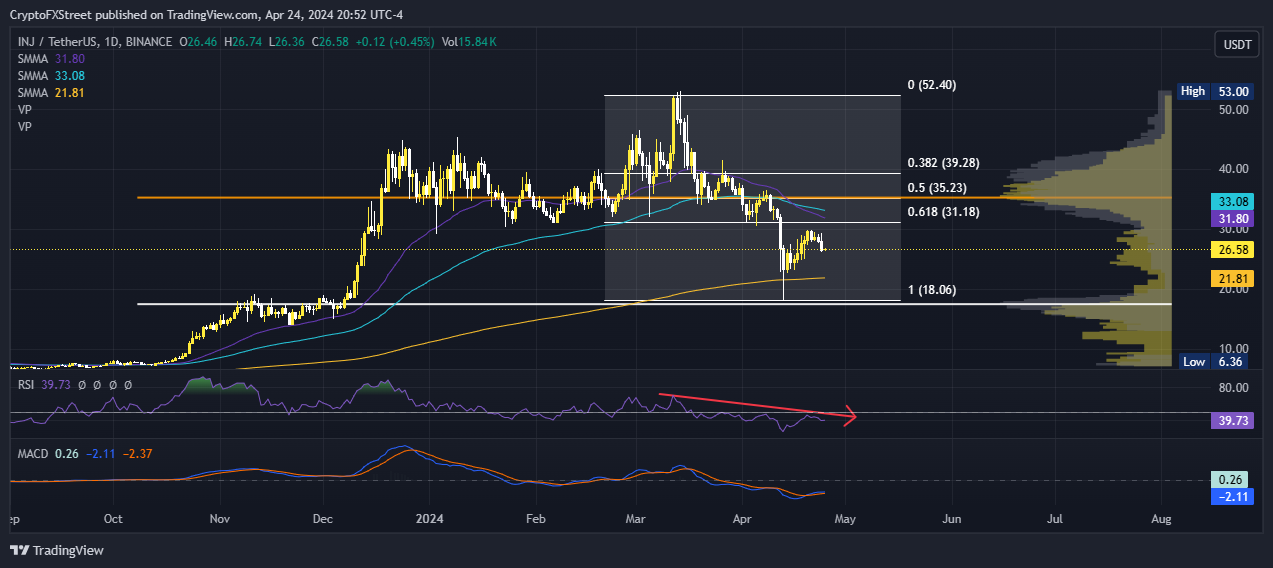
INJ/USDT 1-day chart
Conversely, if bullish momentum grows and Injective price forays into the Golden Zone above the 61.8% Fibonacci retracement level of $31.18, it would entice more buy orders. A candlestick close above the 50% Fibonacci Golden level of $35.23 on the daily chart would invalidate the bearish thesis.
To get here, however, the bulls must overcome resistance due to the 21 and 50-day Smooth Moving Averages (SMMA) at $31.80 and $33.08 levels respectively.
The volume profile shows huge spikes around the area, showing that there is expected surge in bullish trading activity (yellow) once the price reaches this level. This heightened volume often suggests increased buyer interest and demand for the asset, which can push prices higher. Typically, a spike in volume accompanying a price increase is seen as confirmation of the bullish trend.
If buyer momentum overpowers selling pressure, the Injective price could extend the gains beyond the 38.2% Fibonacci retracement level of $39.28, presenting a breakout opportunity for INJ to reclaim the $53.00 range high.
Information on these pages contains forward-looking statements that involve risks and uncertainties. Markets and instruments profiled on this page are for informational purposes only and should not in any way come across as a recommendation to buy or sell in these assets. You should do your own thorough research before making any investment decisions. FXStreet does not in any way guarantee that this information is free from mistakes, errors, or material misstatements. It also does not guarantee that this information is of a timely nature. Investing in Open Markets involves a great deal of risk, including the loss of all or a portion of your investment, as well as emotional distress. All risks, losses and costs associated with investing, including total loss of principal, are your responsibility. The views and opinions expressed in this article are those of the authors and do not necessarily reflect the official policy or position of FXStreet nor its advertisers. The author will not be held responsible for information that is found at the end of links posted on this page.
If not otherwise explicitly mentioned in the body of the article, at the time of writing, the author has no position in any stock mentioned in this article and no business relationship with any company mentioned. The author has not received compensation for writing this article, other than from FXStreet.
FXStreet and the author do not provide personalized recommendations. The author makes no representations as to the accuracy, completeness, or suitability of this information. FXStreet and the author will not be liable for any errors, omissions or any losses, injuries or damages arising from this information and its display or use. Errors and omissions excepted.
The author and FXStreet are not registered investment advisors and nothing in this article is intended to be investment advice.
Recommended Content
Editors’ Picks
Chainlink social dominance hits six-month peak as LINK extends gains
-637336005550289133_XtraSmall.jpg)
Chainlink social dominance surged to a six-month peak on Friday as LINK holders increased their activity. LINK traders started taking profits, on-chain data trackers show. LINK price added 6% on Friday, extending its gains from mid-week.
Binance helps Taiwan crack a virtual asset money laundering case, BNB sustains above $570

Binance’s Financial Crimes Compliance (FCC) department joined forces with Taiwan’s Ministry of Justice and helped resolve a case of money laundering worth NT$200 million, or $6.2 million.
Bitcoin Weekly Forecast: Is BTC out of the woods? Premium

Bitcoin price shows signs of continuing its uptrend, providing a buying opportunity between $64,580 to $63,095. On-chain metrics forecast a bullish outlook for BTC ahead. If BTC clears $70,000, the chances of resuming the uptrend would skyrocket.
XRP trades steady at $0.50 as Ripple shares plan to expand services in Africa

Ripple hovers close to $0.51 on Friday, above the psychologically important $0.50 level, as traders await the court ruling of the lawsuit against the US Securities and Exchange Commission and amid new commitments from the firm to expand its services in Africa.
Bitcoin: Is BTC out of the woods? Premium
Bitcoin (BTC) price action in the past two days has confirmed the resumption of the bull run. However, BTC needs to clear a few key hurdles before investors can go all-in.