- Polkadot price faces an uphill battle between the high-time-frame resistance at $10.37 and other hurdles in its path.
- A decisive four-hour candlestick close above $11 will improve its probability of an upswing to $13.65.
- A four-hour candlestick close below $9.20 will create a lower low and invalidate the bullish thesis for DOT.
Polkadot price wants to embark on an uptrend but the number of hurdles laid in its path suggests this outlook is unlikely. However, a recovery above a certain barrier will make this bullish narrative more plausible.
Polkadot price has an adversarial path
Polkadot price has been consolidating since May 13 and has constantly produced lower highs and lower lows. On June 2, DOT bulls seem to have stepped in, creating a higher low and tighter consolidation. As a result, the June 6 price action has resulted in a 4% upswing.
If Polkadot price continues in this direction, it will face the declining trend line connecting the lower highs formed since May 13 and also the 100 four-hour Simple Moving Average (SMA) at $9.76.
Adding headwinds to this run-up for DOT is the $10.37 high-time-frame resistance level. Therefore, this cluster of hurdles, extending from $9.76 to $10.37 needs to be overcome for a chance at an upswing. Beyond these blockades, there is also the 200 four-hour SMA at $10.75, which will test the bulls’ strength again.
If Polkadot price manages to produce a four-hour candlestick close above this level and uses it as a support level, the chances of an upswing will multiply. In such a case, investors can expect DOT to attempt a 26% rally to another high-time-frame resistance barrier at $13.65.
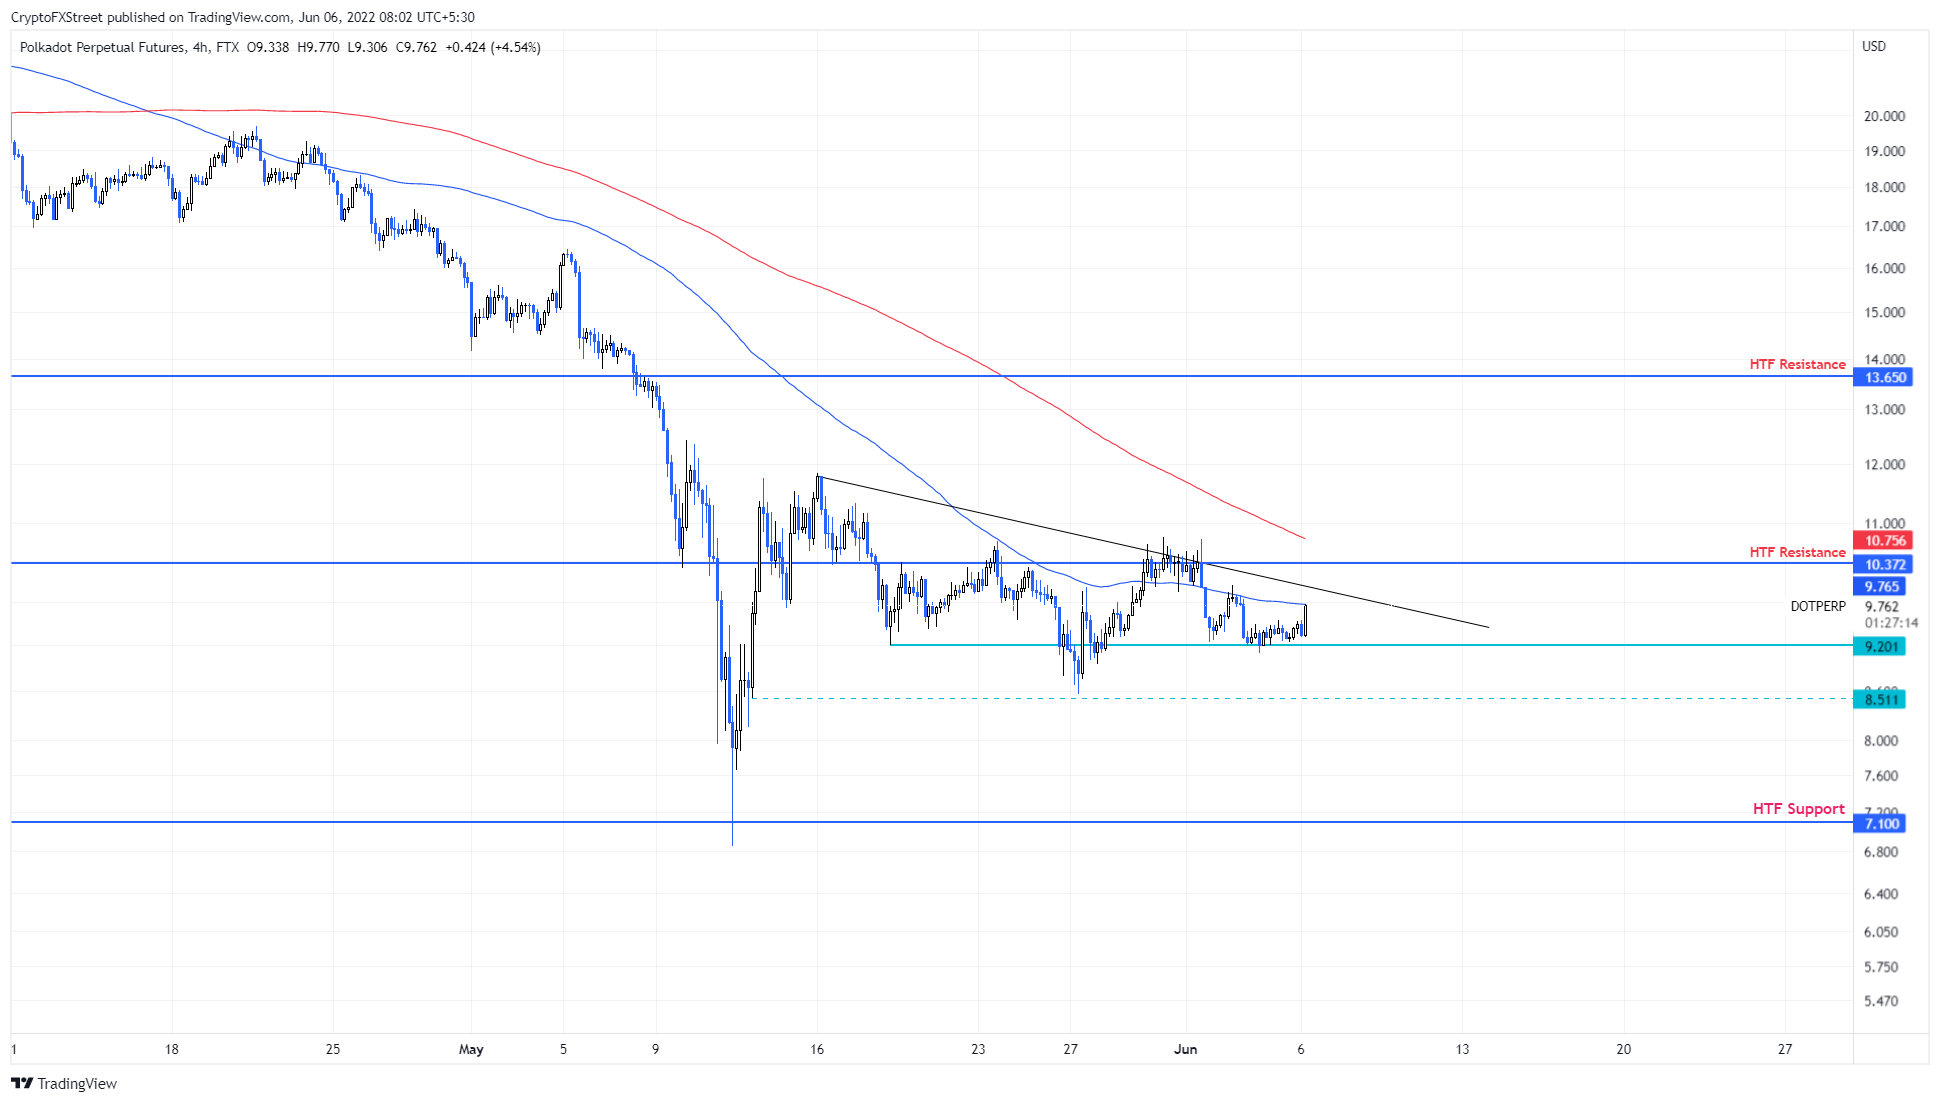
DOT/USDT 4-hour chart
While things are looking particularly tough for Polkadot price and the bulls, rejection at any of these levels could hinder the optimistic narrative. If DOT produces a four-hour candlestick below $9.20, it will create a lower low and invalidate the bullish thesis for DOT.
In such a case, Polkadot price could spend time at an intermediate support level at $8.51 and eventually crash to $7.10 if the selling pressure continues to build up.
Information on these pages contains forward-looking statements that involve risks and uncertainties. Markets and instruments profiled on this page are for informational purposes only and should not in any way come across as a recommendation to buy or sell in these assets. You should do your own thorough research before making any investment decisions. FXStreet does not in any way guarantee that this information is free from mistakes, errors, or material misstatements. It also does not guarantee that this information is of a timely nature. Investing in Open Markets involves a great deal of risk, including the loss of all or a portion of your investment, as well as emotional distress. All risks, losses and costs associated with investing, including total loss of principal, are your responsibility. The views and opinions expressed in this article are those of the authors and do not necessarily reflect the official policy or position of FXStreet nor its advertisers. The author will not be held responsible for information that is found at the end of links posted on this page.
If not otherwise explicitly mentioned in the body of the article, at the time of writing, the author has no position in any stock mentioned in this article and no business relationship with any company mentioned. The author has not received compensation for writing this article, other than from FXStreet.
FXStreet and the author do not provide personalized recommendations. The author makes no representations as to the accuracy, completeness, or suitability of this information. FXStreet and the author will not be liable for any errors, omissions or any losses, injuries or damages arising from this information and its display or use. Errors and omissions excepted.
The author and FXStreet are not registered investment advisors and nothing in this article is intended to be investment advice.
Recommended Content
Editors’ Picks
Crypto traders brace for short-term volatility with $2.4 billion options expiry on Friday

Bitcoin and Ethereum options market looks bullish on Friday, according to data from intelligence tracker Greeks.live. The firm said it has identified two Bitcoin calls that show an underlying bullish sentiment among market participants.
XRP recovers from week-long decline following Ripple’s response to SEC motion

Ripple filed a letter to the court to support its April 22 motion to strike new expert materials. The legal clash concerns whether SEC accountant Andrea Fox's testimony should be treated as a summary or expert witness.
Lido adds 4% gains as protocol rolls out first step towards decentralization
Lido takes the first batch of simple DVT validators to live, a step taken to decentralize the protocol. Lido leveraged technology to expand the protocol to multiple node operators, inviting both solo and community stakers.
Bitcoin Weekly Forecast: Should you buy BTC here? Premium

Bitcoin (BTC) price shows signs of a potential reversal but lacks confirmation, which has divided the investor community into two – those who are buying the dips and those who are expecting a further correction.
Bitcoin: Should you buy BTC here? Premium
Bitcoin (BTC) price shows signs of a potential reversal but lacks confirmation, which has divided the investor community into two – those who are buying the dips and those who are expecting a further correction.