Can bears keep control of Polkadot price
- Polkadot price is close to completing a pennant price pattern.
- DOT price looks set to break to the downside, but bears could be in for a surprise.
- Expect to see a tight turnaround and bulls pushing price action back above $13.

Polkadot (DOT) price is at the cusp of soon breaking out of the pennant and dropping to the downside as bears are still very much in the driving seat. The downside breakout, however, may well be a fake out with bulls set to take over and pull a bear trap to squeeze out sellers towards $13. This coincides with the Relative Strength Index (RSI), which is likely to first dip towards oversold before shooting higher and even crossing towards being overbought.
Depending on the swing, 60% gains could be in the making
Polkadot price is close to breaking out of the pennant that has formed since May 12. A turning point looks to be just around the corner and will likely favour bears as several downtrend elements are still very much present and doing their part to push price action lower.
DOT price, however, could see a quick turn around, with bears being kicked out of the car and bulls taking over the wheel. The break could bounce off $8 and then swing quickly to the upside towards at least $11.86 for a test at this preliminary level. Once there, the $14-marker will be in sight to test the 55-day Simple Moving Average if it is possible to break it and open some possibilities to end the downtrend.
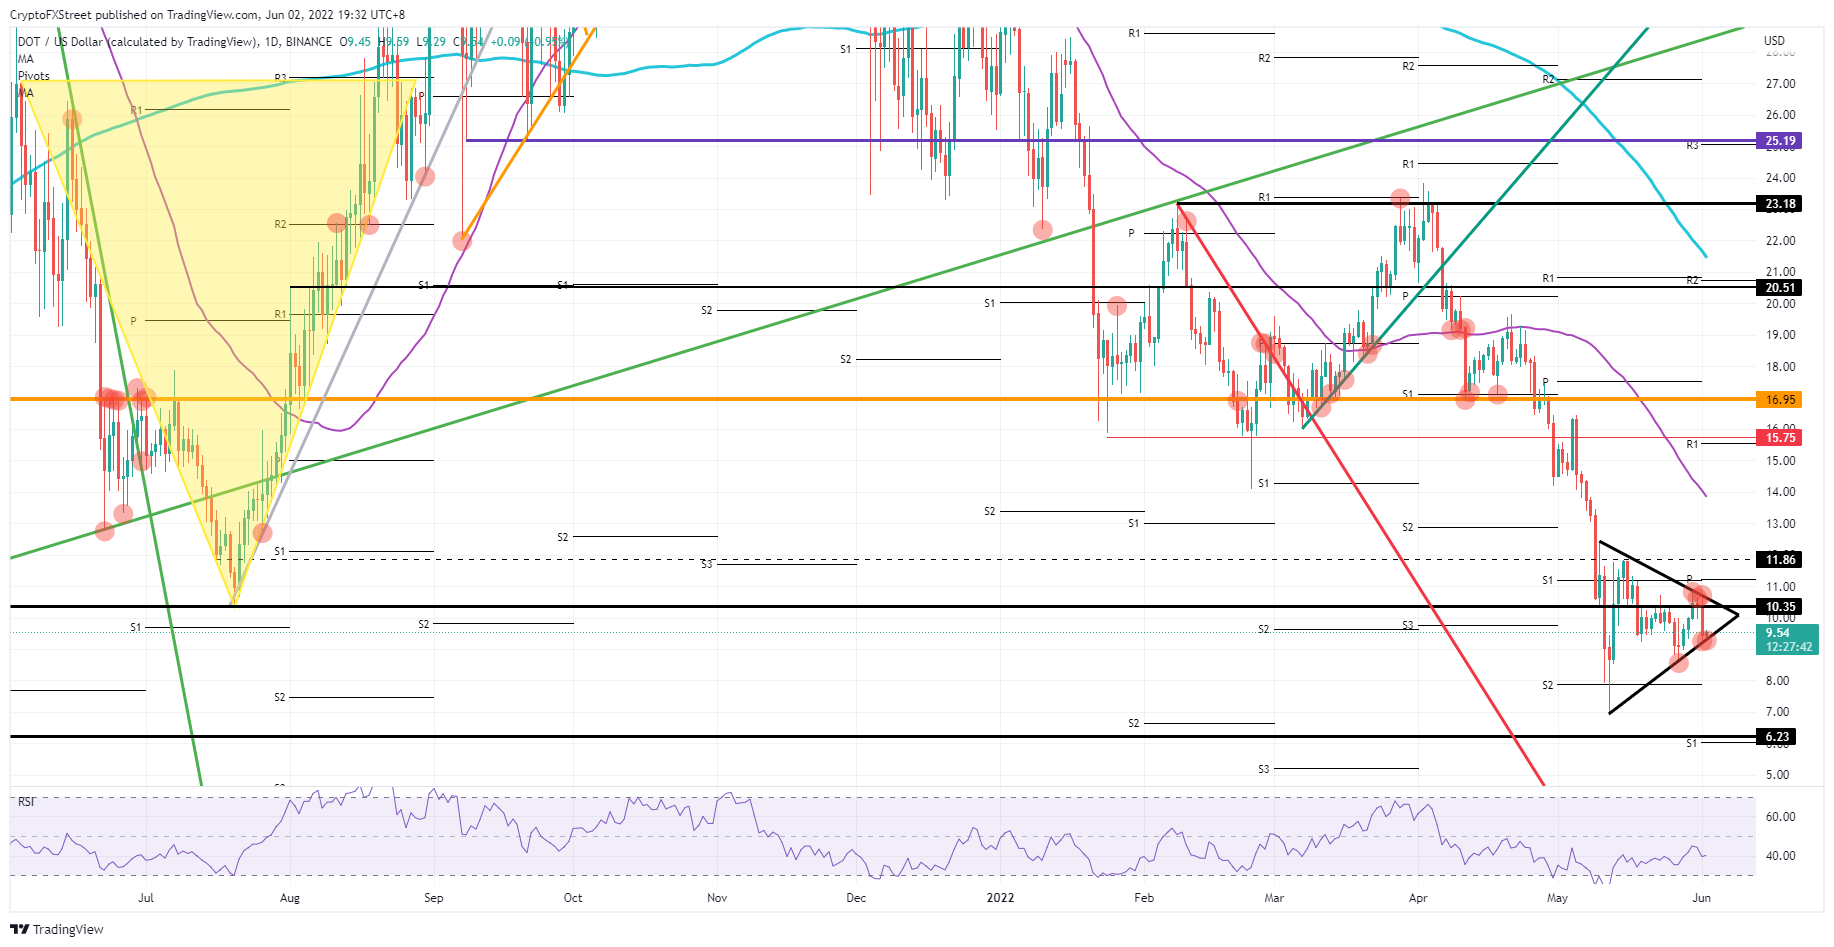
DOT/USD daily chart
A similar pattern could unfold for bulls. A bullish breakout of the pennant could see bulls then getting rejected at around $11 where the new monthly pivot falls in line with the previous month's S1. That rejection could trap bulls who got in at the upside breaking point and squeeze them out to the downside towards $7 for a test on the low of May. A quick drop towards $6.23 could be plausible where price will search for support if it undershoots the $7 mark.
Author

Filip Lagaart
FXStreet
Filip Lagaart is a former sales/trader with over 15 years of financial markets expertise under its belt.


