|

Solana price has Smart Money traps embedded in the price action

  • Solana price has breached the 50-day moving average.
  • SOL is coiling into a wedge-like pattern.
  • Invalidation of the bearish thesis is a close above $110.

Solana price could fall towards $80 to grab liquidity as the bulls have yet to show any interest in the $97 price levels. To create a climatic downslide, market makers could entice traders to open long positions in the coming weeks. 

Solana price says, "expect choppy fakeouts" 

Solana price is currently trading at $97 and coiling into a wedge-like pattern. The wedge pattern forecasts a 6-10% move which could take the price back to $105. However, analyzing the technicals proposes that this wedge could be a part of a larger complex correction. If traders get overzealous, Solana price could trap traders on the wrong side of the trend.

Solana price is back above the buyers' territory on the daily Chart, which confuses a bullish counter-trend move. However, the 50-Day moving average has already been breached and retested before being suppressed to the current $97 levels. The SOL price could continue to chop around this area before making way to $88 and $80

TM/SOl/4.27.22

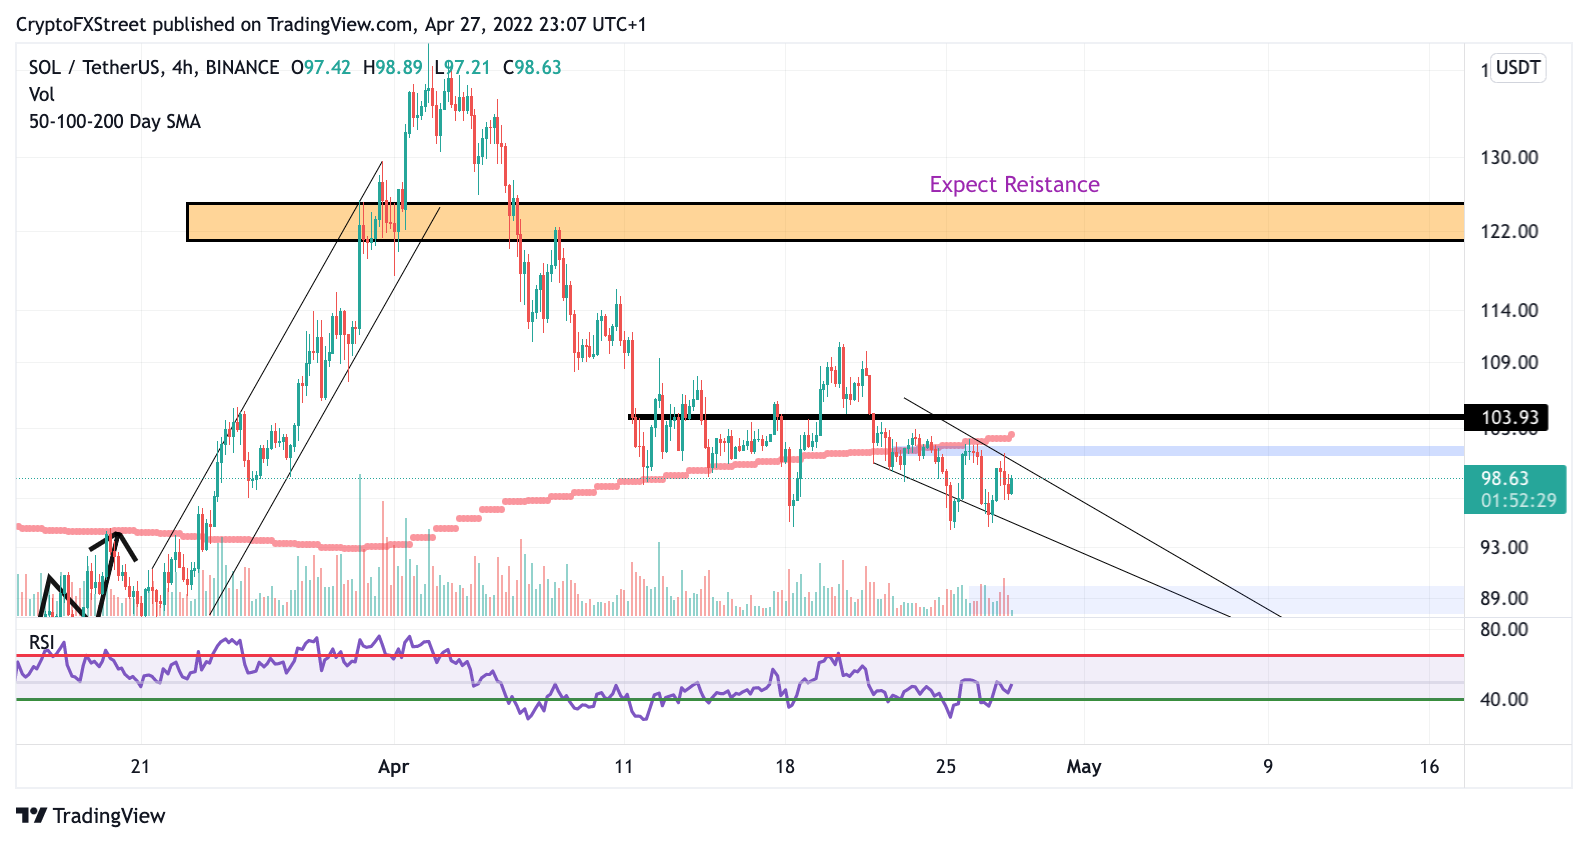
SOL/USDT 4-Hour Chart

Traders should look for better opportunities in the market to avoid unnecessary losses. This Chart is very complex and does not forecast any significant moves at the moment. Invalidation of the current bearish thesis is a close above $110. If this price breach occurs, a revised count will be necessary. There is a slim chance Solana price could climb to $120, resulting in a 25% increase from the current price.

Author

Tony M.

Tony M.

FXStreet Contributor

Tony Montpeirous began investing in cryptocurrencies in 2017. His trading style incorporates Elliot Wave, Auction Market Theory, Fibonacci and price action as the cornerstone of his technical analysis.

More from Tony M.
Share:

Editor's Picks

Bitcoin, Ethereum and Ripple consolidate after massive sell-off

Bitcoin, Ethereum, and Ripple prices consolidated on Monday after correcting by nearly 9%, 8%, and 10% in the previous week, respectively. BTC is hovering around $70,000, while ETH and XRP are facing rejection at key levels. Traders should be cautious: despite recent stabilization, upside recovery for these top three cryptocurrencies is capped as the broader trend remains bearish.

Ethereum: Trend Research capitulates, BitMine's Thomas Lee sees a V-shaped recovery

Ethereum had one of its sharpest historic declines over the past 10 days, shedding 40% of its value and briefly sliding below $2,000. The dip also saw ETH move below its realized price, or the average cost basis of investors — an occurrence that has historically accelerated selling pressure as investors cut losses.

Why Bitcoin and top cryptos are falling: Bitwise

The crypto market crash since October isn't down to a single factor but a combination of several, according to Bitwise CIO Matt Hougan. In a note to investors on Friday, Hougan outlined six key factors that potentially contributed to the crash that pushed down nearly every top crypto by more than 50% from prices seen over four months ago.

XRP recovery gains momentum despite retail market decline

Ripple is accelerating its recovery, trading above $1.36 at the time of writing on Friday, as investors adjust their positions following a turbulent week in the broader crypto market. The remittance token is up over 21% from its intraday low of $1.12.

Bitcoin Price Annual Forecast: BTC holds long-term bullish structure heading into 2026

Bitcoin (BTC) is wrapping up 2025 as one of its most eventful years, defined by unprecedented institutional participation, major regulatory developments, and extreme price volatility.

Bitcoin: The worst may be behind us

Bitcoin (BTC) price recovers slightly, trading at $65,000 at the time of writing on Friday, after reaching a low of $60,000 during the early Asian trading session. The Crypto King remained under pressure so far this week, posting three consecutive weeks of losses exceeding 30%.