How MATIC price can reach a new all-time high at $3
- MATIC price is close to tagging the $1.44 to $1.53 demand zone.
- On-chain metrics and technical outlook suggest a bullish move to $2 is likely.
- A daily candlestick close below $1.44 will invalidate the bullish thesis for Polygon.

MATIC price shows signs of exhaustion but is fast approaching a stable support area that could be the key to triggering a run-up to new highs. On-chain metrics, especially, the transaction data add credence to the move to a new all-time high.
MATIC price reveals a bullish setup
MATIC price set up a range, extending from $1.24 to $1.69 after rallying 36% between February 24 and March 2. The swing high and low formed during this uptrend is serving as local top and bottom, respectively, causing Polygon to bracket.
The recent uptick that led to a 21% ascent in MATIC price from $1.44 tried breaching the upper limit at $1.69 but failed to push through. As a result, Polygon bears took over, leading to an 11% retracement so far.
Interestingly, MATIC price has the $1.44 to $1.53 demand zone serving as a launching pad. Therefore, investors can expect a massive bounce on the retest of the said support area to propel Polygon beyond the range high of $1.69. A successful flip of this level will open the path for a revisit of the $1.87 level.
Clearing this ceiling will provide Polygon with a resistance-free path to its all-time high at $2.90 with an extension to $3.
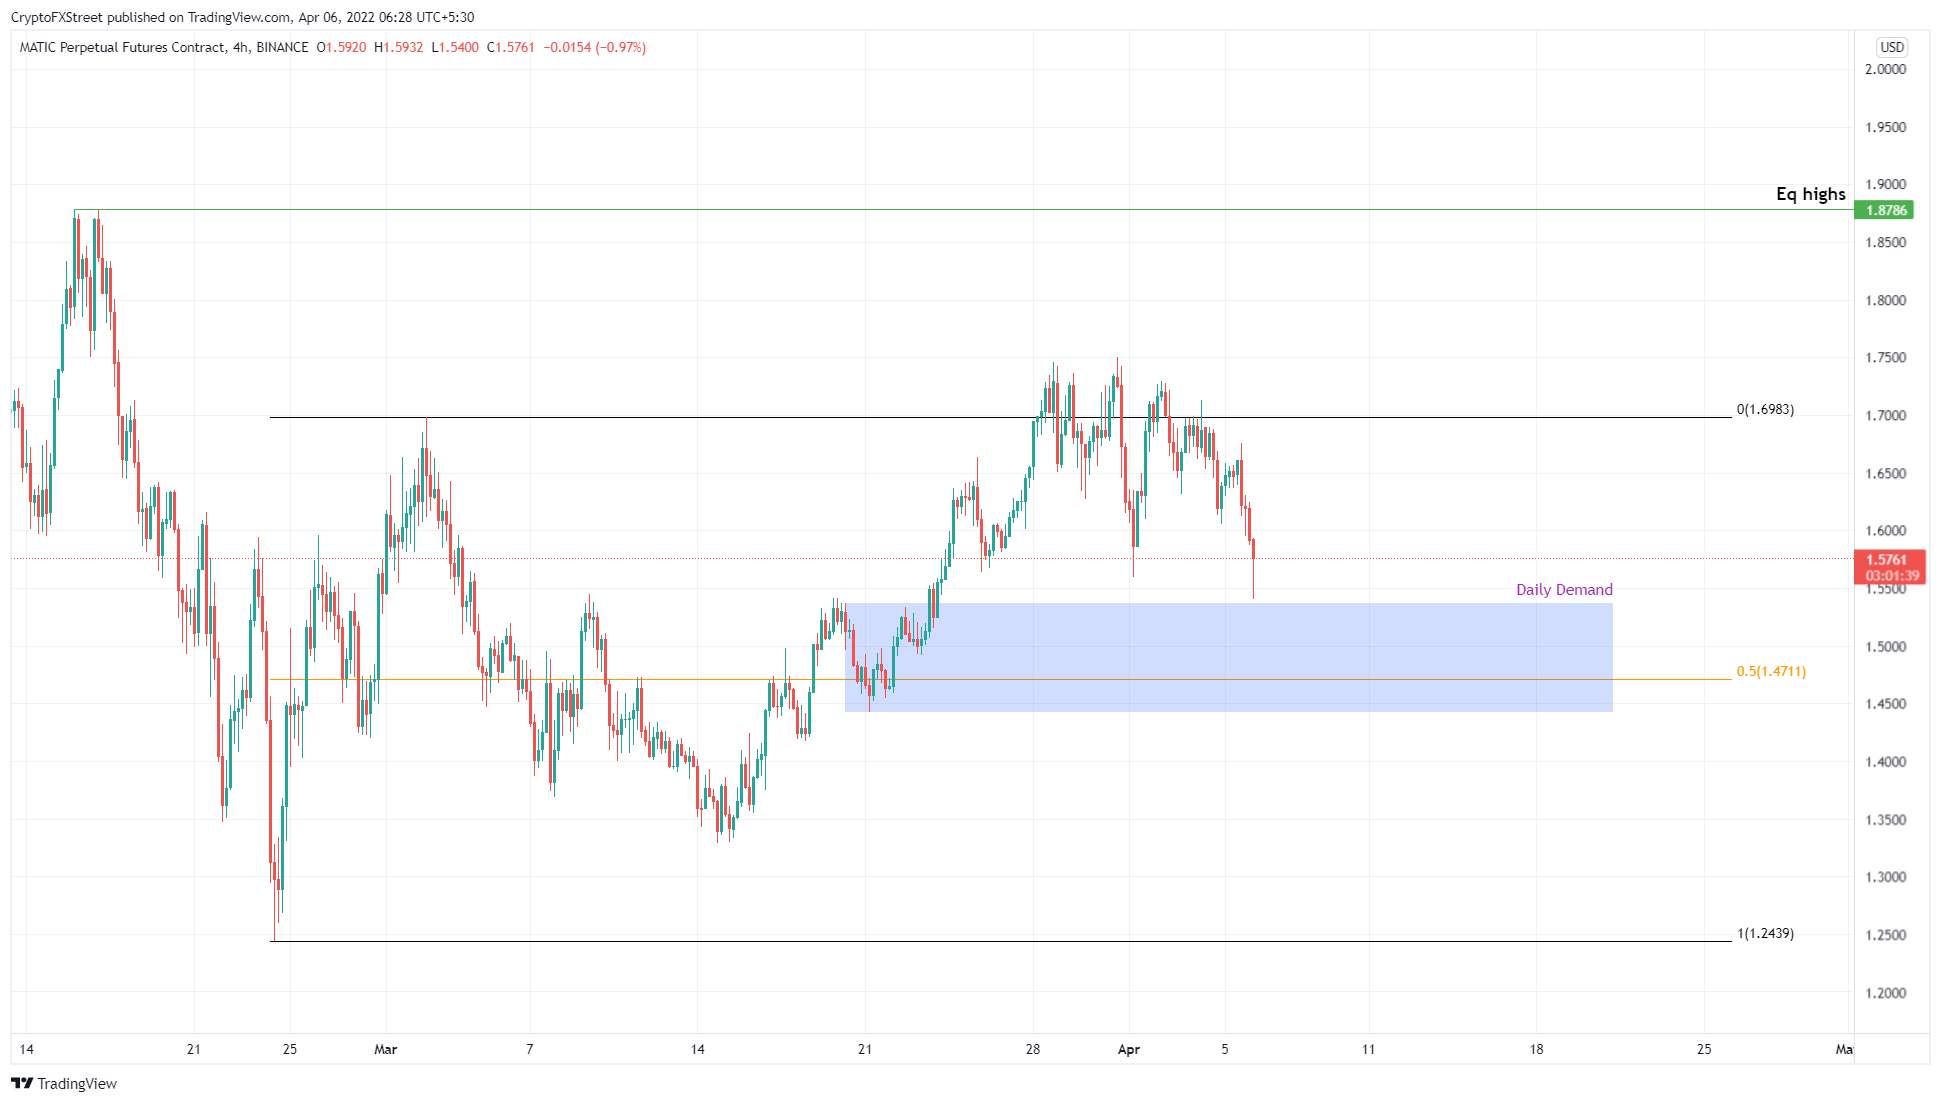
MATIC/USDT 1-day chart
Supporting this uptrend for Polygon is IntoTheBlock’s Global In/Out of the Money (GIOM) model. This index shows that roughly 35,000 addresses that purchased nearly $3.24 billion MATIC tokens at an average price of $1.65 are “Out of the Money.”
The clusters of underwater investors beyond this area are relatively meager and are unlikely to pose any threat to the upswing. Interestingly, this proof coincides with the bullish outlook detailed from a technical standpoint.
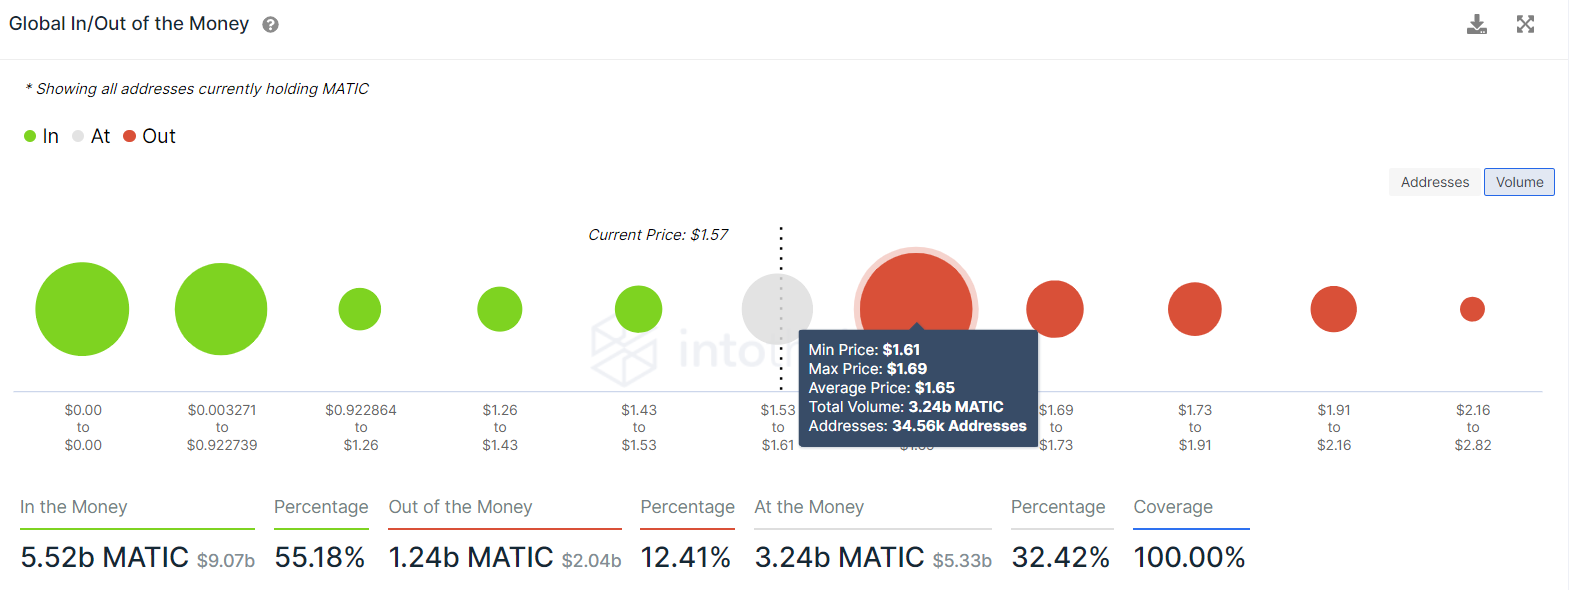
MATIC GIOM
Regardless of the bullishness displayed by MATIC price from a technical point of view, a sudden nosedive in Bitcoin price will drag altcoins down with it.
In such a case, a daily candlestick close below $1.44 will invalidate the bullish thesis for MATIC price. This development is key in pushing Polygon down to the range low at $1.24.
Author

Akash Girimath
FXStreet
Akash Girimath is a Mechanical Engineer interested in the chaos of the financial markets. Trying to make sense of this convoluted yet fascinating space, he switched his engineering job to become a crypto reporter and analyst.


