MATIC price is still in an uptrend towards $2.00, but traders should be aware of these factors
- MATIC price is coiling above the previous supply zone.
- Polygon price action may be trading within a corrective rally.
- A close below $1.44 will invalidate the bullish thesis.

MATIC price could be showing early signs of a pause in the uptrend. Traders should watch Thursday's closing candle before making any longer-term decisions.
MATIC price is dependent on tomorrow's close
MATIC price has enjoyed a 12% rally this week. It was mentioned in last week's thesis that the first candle break above the supply zone would send the MATIC price into the previous weekly high at $1.70. On March 22, the anticipated breakout did occur, which enabled the bulls to establish a new weekly high at $1.74.
MATIC price is now hovering below the new pivot level at $1.70. Traders should expect back and forth price action on smaller time frames as market makers will be looking to collect liquidity from weak-handed traders.
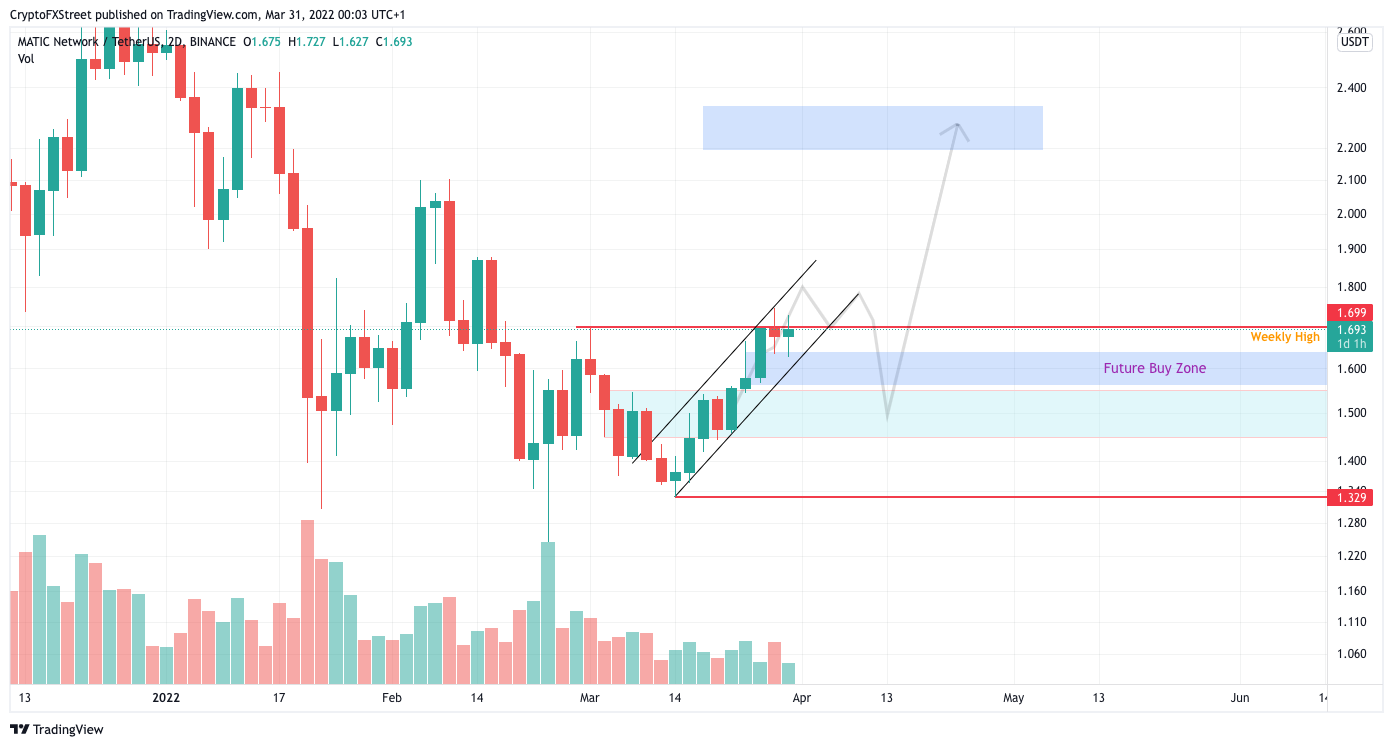
MATIC/USDT 2-Day Chart
The 2-Day Chart displays a vital key for the MATIC price. For one, the Polygon price has to break the parallel trend channel. Secondly, the price has not established a closing candle above the previous weekly pivot point. These factors could be early evidence that the recent MATIC price increase is just a corrective rally. However, traders should remember that the 2-day candle has one more trading day before the final settlement price is established. If the bulls can establish a 2-day high above $1.70, prices will likely increase.
Thus, the bulls aiming for last week's $2.00 target should be careful. The uptrend will be deemed invalid if the bears can print a closing candle below $1.44 on the 2-day Chart. If this were to occur, The swing lows in the $1.20 area would be in jeopardy, resulting in up to a 30% dip below the current MATIC price.
Author
FXStreet Team
FXStreet
Composed of a group of economic journalists and FX experts, the FXStreet content team produces and oversees all content published on FXStreet. It provides a purely journalistic approach to the Forex market.


