How Algorand price prepares that will liquidate bears
- Algorand price is set to complete a bearish triangle, breaking the monthly S1 support.
- ALGO could be dumped towards $0.30, but expect a significant shift in sentiment as bulls scope up price action.
- A bear trap is thus looming and could see a violent squeeze towards $0.50, pumping up the price by 60%.

Algorand (ALGO) is set to take a step back but then rally a long way with the final removal of a bearish element. After the completion of a bearish triangle, bulls will have the opportunity to jump into price action at significantly discounted prices and then ramp up price by 60% in what will be the largest bear trap and short squeeze in ALGO’s history. If bulls can play their cards right, even an upswing towards $0.60 is possible.
ALGO is set for a short squeeze with bulls likely to crowd the scene
Algorand (ALGO) price is set to complete a bearish triangle – with the descending black trendline from $0.50 as the hypotenuse and the baseline as the monthly S1 around $0.41. This should result in an initial break lower for Algorand price , roughly towards $0.30, with the Relative Strength Index (RSI) breaking back into the oversold area. However, with bears lacking an incentive to rally further, bulls should have a free lunch to get in on the price action, sparking a quick turnaround towards $0.50, from there, breaking back above the bearish triangle and catching bears in a bear trap, that will squeeze them out.
ALGO price will – once it hits $0.30 or even $0.23 – rebound and form a very violent breakout that will slice like a knife through butter back up through $0.30. The critical element here is for traders that are not part of the price action not to chase the move but instead wait for consolidation at $0.50 and enter there for a rally towards $0.65. At that level there is a quadruple technical resistance from the 55-day Simple Moving Average (SMA), the red descending trend line, the monthly pivot and a historic pivotal level from February 24.
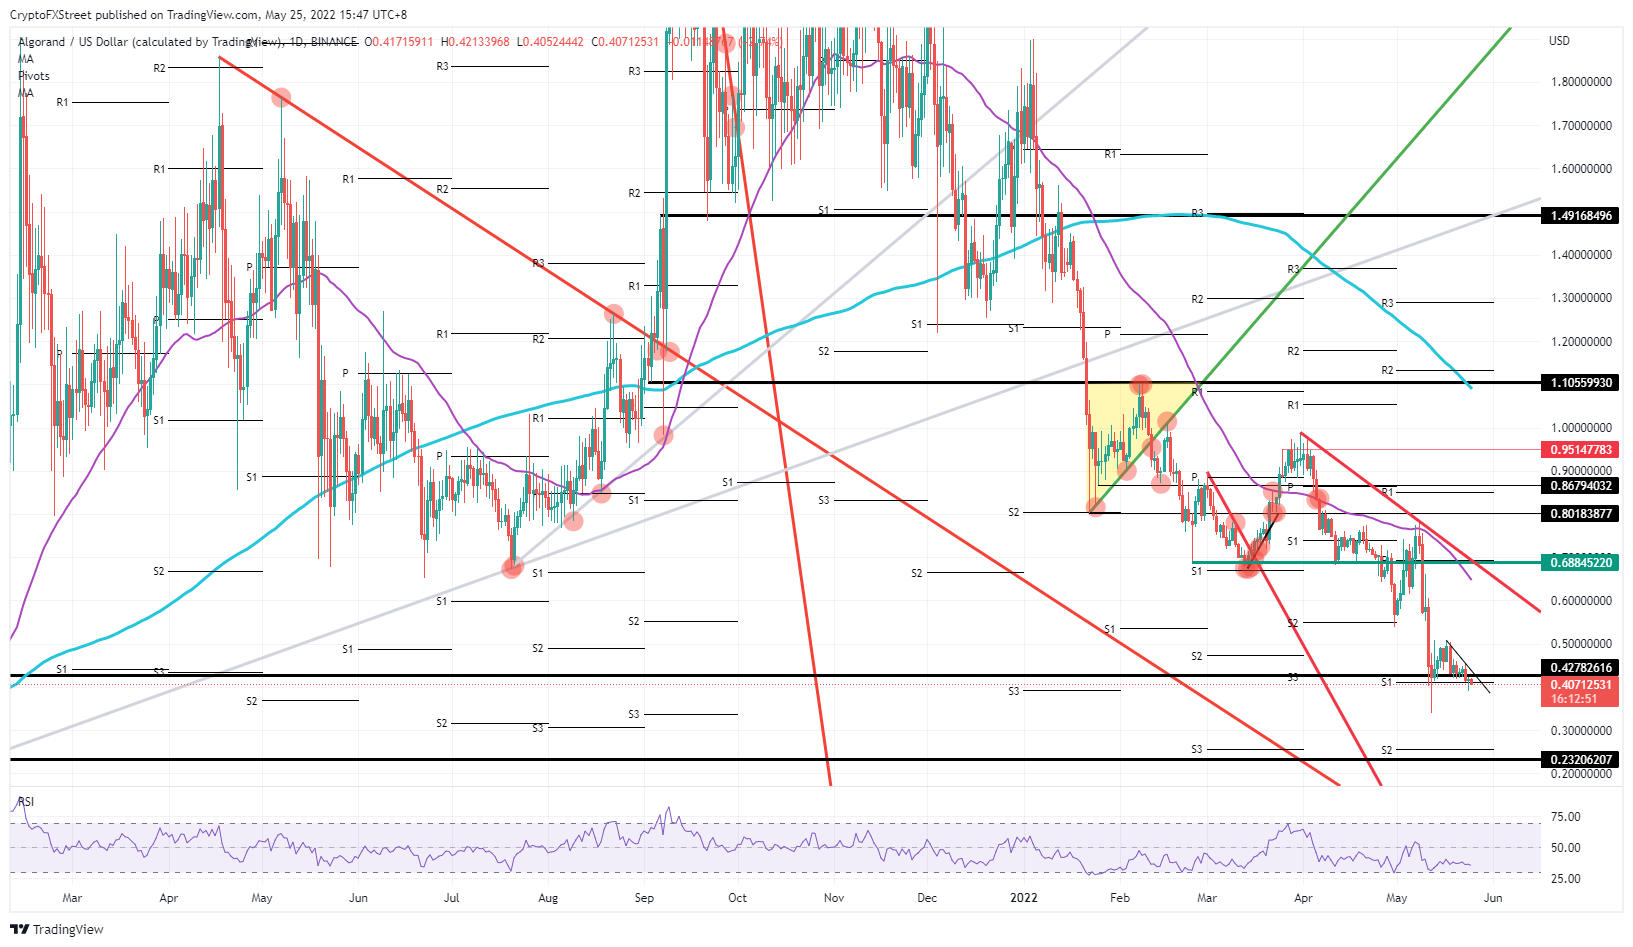
ALGO/USD daily chart
At risk is another correction of roughly 45% towards $0.23, which is the last line of defence before a move down below $0.20 and the monthly S2 support level. Although this level is already mentioned in the above paragraph, it would need a quick rebound off that level, in just a matter of minutes. In a case ALGO consolidates at $0.23 and trades at that level for several days, even starts to form a squeeze to the downside, expect then more losses to come.
Author

Filip Lagaart
FXStreet
Filip Lagaart is a former sales/trader with over 15 years of financial markets expertise under its belt.




