Here’s why MATIC price is due for a 20% rally
- MATIC price has collected liquidity below March 15 swing lows, suggesting a potential end of the downswing.
- Investors can expect a base to form between $1.24 and $1.33 before a 20% ascent to $1.69.
- A six-hour candlestick close below $1.24 will invalidate the bullish thesis for Polygon.

MATIC price is in a spot where an upswing possibility makes sense from a technical standpoint. The on-chain metrics also point out that a short-term uptrend seems likely in the coming days for Polygon.
MATIC price needs to pick a side
MATIC price rallied 36% from $1.24 between February 24 and March 2 to set a swing high at $1.69. This rally defined a range that Polygon has been traversing since March 2 and is likely going to do the same for the foreseeable future.
After a brief deviation above the range high in late March and early April, MATIC price has crashed roughly 23% to sweep below the equal lows formed on March 15. This liquidity grab movement indicates that a further downswing is unlikely.
Therefore, investors can expect MATIC price to consolidate between the recently formed support at $1.32 and the range’s midpoint at $1.47. However, in some cases, the downswing could extend, causing Polygon to coil up between $1.32 and the range low at $1.24.
Either way, a breakout from this consolidation is likely to propel MATIC price to retest the range high at $1.69.
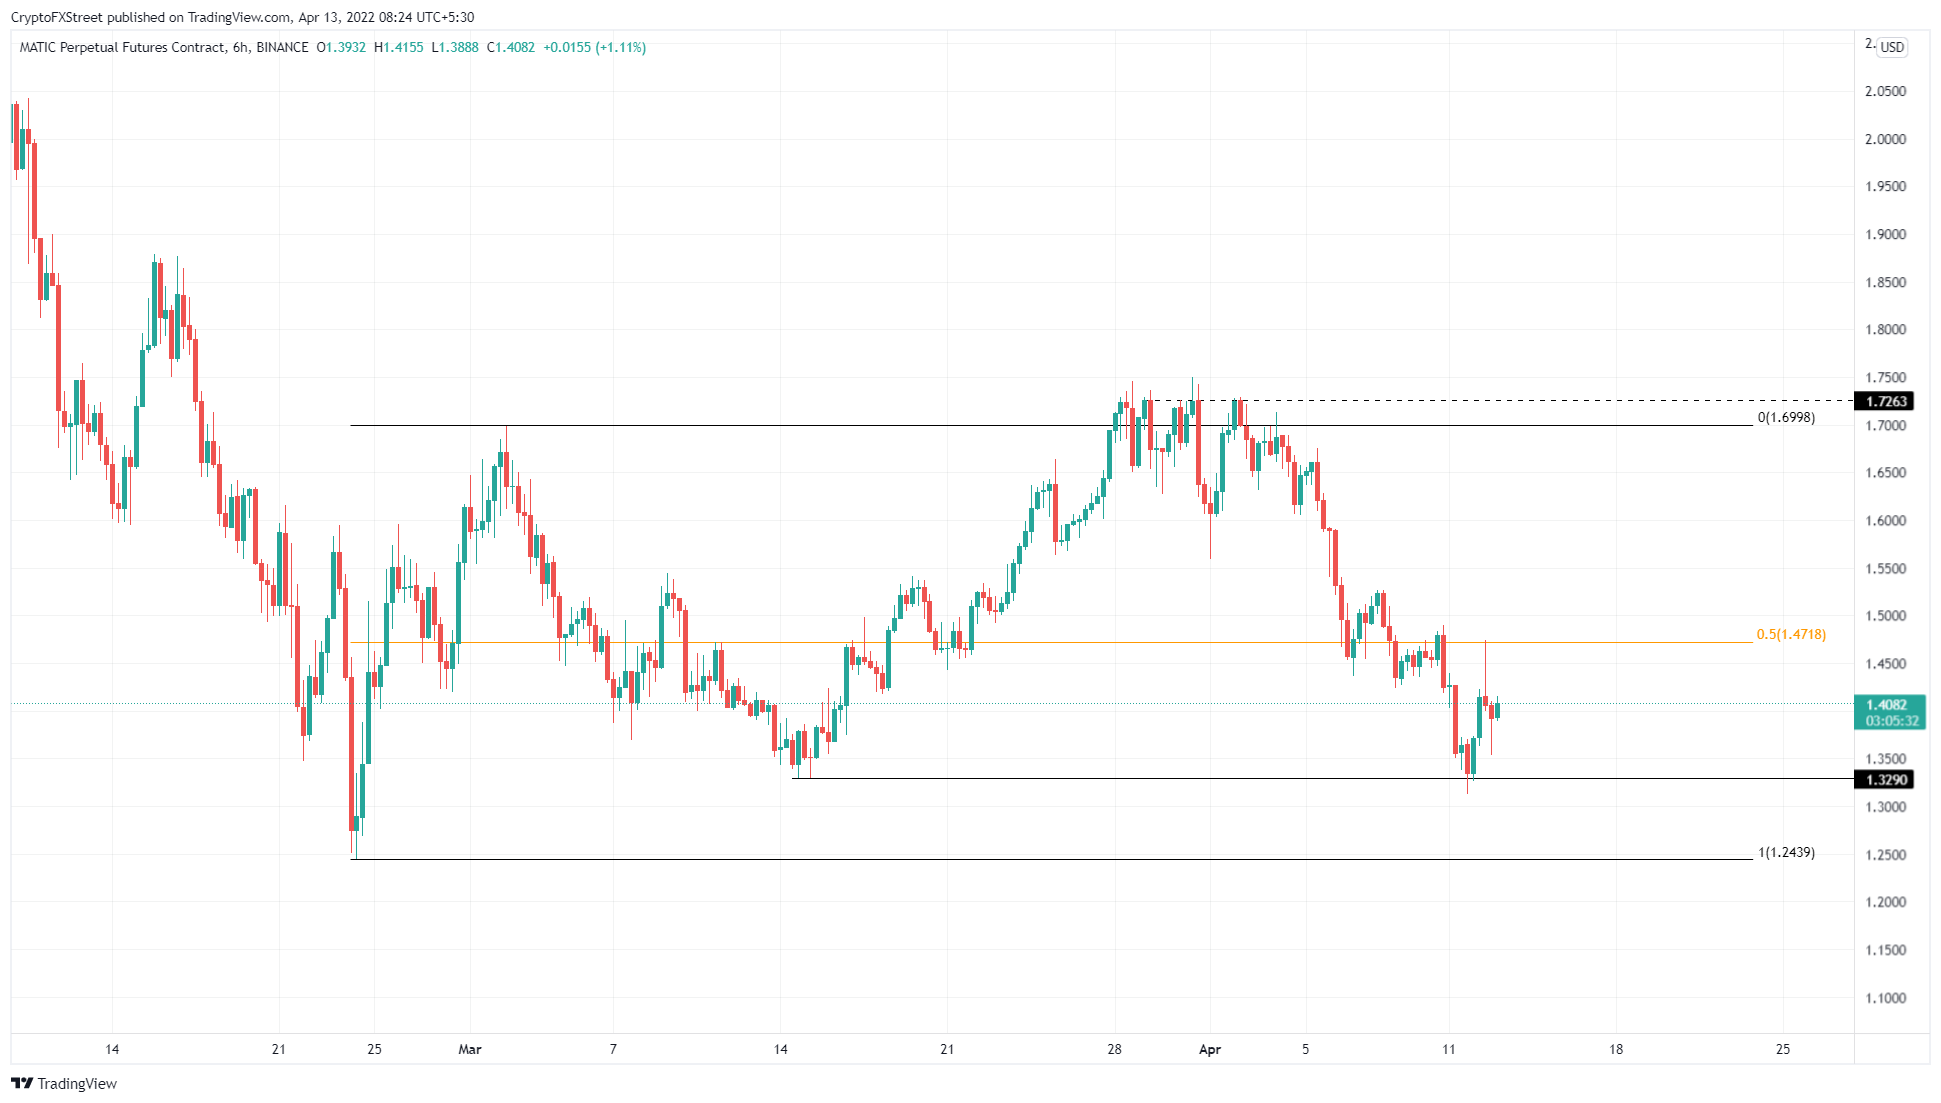
MATIC/USDT 1-day chart
Supporting this upward move for MATIC price is the 30-day Market Value to Realized Value (MVRV) This on-chain metric is used to determine the average profit/loss of investors that purchased MATIC over the past year or month.
Based on the six-month history, local bottoms are formed at around -15%. Considering that the MVRV has already tagged this level a reversal is likely to occur.
 [08.16.28, 13 Apr, 2022]-637854226657200274.png)
MATIC 30-day MVRV
On the other hand, if MATIC price produces a six-hour candlestick close below $1.24, it will invalidate the bullish thesis by producing a lower low. In such a case, Polygon could slide lower to find a stable support level.
Author

Akash Girimath
FXStreet
Akash Girimath is a Mechanical Engineer interested in the chaos of the financial markets. Trying to make sense of this convoluted yet fascinating space, he switched his engineering job to become a crypto reporter and analyst.




