Here is why you should wait for XRP price final descent before buying the dip
- XRP price attempts to recover from its recent support at $0.3320.
- A bear flag on the four-hour chart might trigger another dip to $0.2930.
- XRP’s declining network activity stands in the way of sustainable bullish momentum.

XRP price is pushing for a recovery rally after bouncing off support at $0.3320. A bear flag governs the international money remittance token, casting doubt on the bulls’ desire to tag $0.3600 and $0.3800, respectively. Traders may want to closely follow this rebound because the appearance of a bear flag implies XRP price is not out of the woods yet.
What’s holding XRP price recovery back?
The number of active daily active addresses on the XRP Ledger fell sharply in the second week of August from roughly 179,000 to approximately 10,700 at the time of writing. The Daily Active Addresses metric tracks the number of unique addresses transacting on the blockchain network.
Such a steep drop reveals a massive flop in the level of crowd interaction, otherwise referred to as speculation. To put it in another way, a decrease in network activity negatively impacts XRP price, resulting in lengthy mundane trading periods and more dips.
 [15.30.54, 24 Aug, 2022]-637969475614580086.png)
XRP Daily Active Addresses Metric
Network Growth, a slightly different on-chain metric, affirms the impending XRP price drop. Only 841 new addresses joined the XRP Ledger on August 23 – a significant six-month drop from 5,175 on March 1. It is worth mentioning that the Network Growth metric shows user adoption over time – with this colossal drop signifying a continuous loss of traction.
 [15.30.18, 24 Aug, 2022]-637969479511461318.png)
XRP Network Growth
XRP price is wading through mucky waters from a technical perspective. The minor recovery from its recent support at $0.2930 is expected to culminate in more losses ascribed to a bear flag pattern, as shown on the four-hour chart.
A bear flag often marks the continuation of an existing downward trend. Once the upward sloping consolidation is identified, traders wait for the price to crack the channel’s lower support line. If confirmed, this governing chart pattern could trigger XRP price declines to $0.2930 – a drop equal to the length of the flagpole.
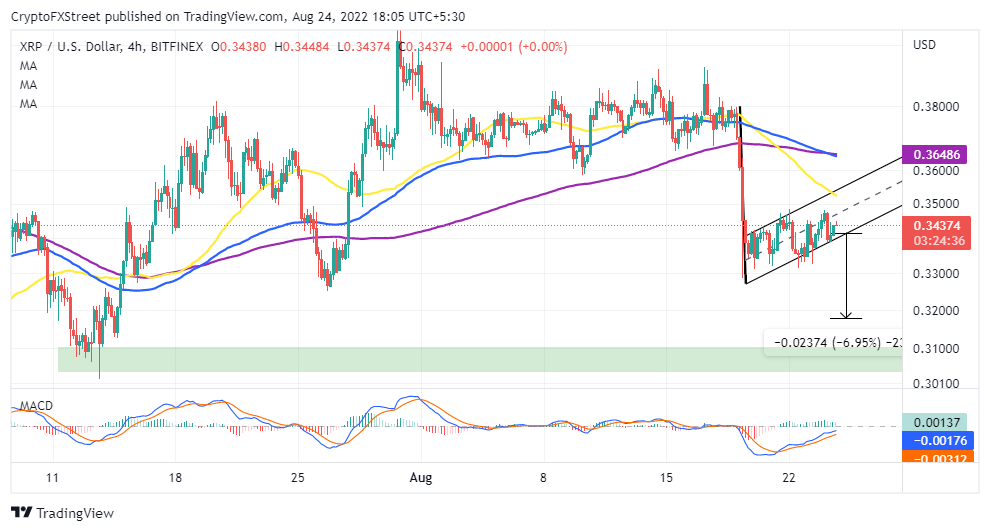
XRP/USD four-hour chart
On the upside, the 13.76% drop to $0.2930 would be invalidated if the flag section of the bear pattern above exceeds half the length of the pole – confirming an ascending channel. A four-hour to a daily close above the channel’s through line would then uphold the Ripple bulls’ grip and clear the path to $0.3600 and $0.3800.
Author

John Isige
FXStreet
John Isige is a seasoned cryptocurrency journalist and markets analyst committed to delivering high-quality, actionable insights tailored to traders, investors, and crypto enthusiasts. He enjoys deep dives into emerging Web3 tren


