Here is why Solana price is still in the buy zone, ready to climb to $50
- Solana price is up 14% since its latest dip to $34.77 on July 26.
- Following a falling wedge pattern breakout, this trend correction may propel SOL price by roughly 22% to $46.78.
- Traders should tread cautiously while keeping in mind an incoming sell signal from the TD Sequential indicator.

Solana price rallied alongside its peers after the Federal Reserve raised interest rates by 75 basis points at their meeting on Wednesday. The competitive smart contracts token extended its bullish correction from the $34.77 support established on July 26. Although SOL is trading at $40 at the time of writing, it has the potential to close the gap to $50, bolstered by a falling wedge pattern.
Crypto market reacts positively to the Fed interest rate hike
For the second time in a row, the Fed raised its benchmark interest rate by 75 basis points to combat inflation. The regulator plans to bring the benchmark rate between 2.25% and 2.5%. This will be the highest level since 2018 and is expected to impact consumer and commercial loans directly.
The cryptocurrency market reacted positively to the news, with Bitcoin price soaring above $23,000. Ethereum price followed in the flagship cryptocurrency’s footsteps to trade at $1,626. On the other hand, Solana is seeking a balance marginally above $40 while awaiting a 22% boost to $46.72.
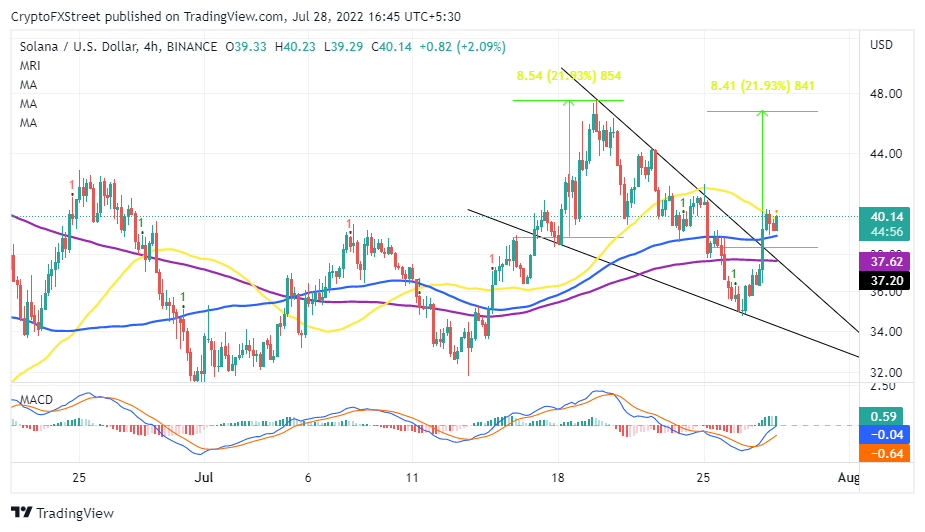
SOL/USD four-hour chart
The above chart shows the formation of a falling wedge pattern, which came into the picture after Solana price got rejected from $46.78. This pattern is highly bullish and often marks the end of a downtrend. It also paves the way for an exact recovery target equal to the distance between the widest points of the pattern.
Since Solana price is already holding above the upper trendline of the wedge, the only remaining task is to deal with the challenging pressure at the 50-4hr Simple Moving Average (SMA). A four-hour to a daily close above this level will confirm the token’s stability and encourage more investors to seize the opportunity to buy. The Moving Average Convergence Divergence’s (MACD) positive outlook also adds credibility to the impending 22% move to $46.72. A break into the area above the mean line could seal the deal for Solana price to quickly approach the $50 level.
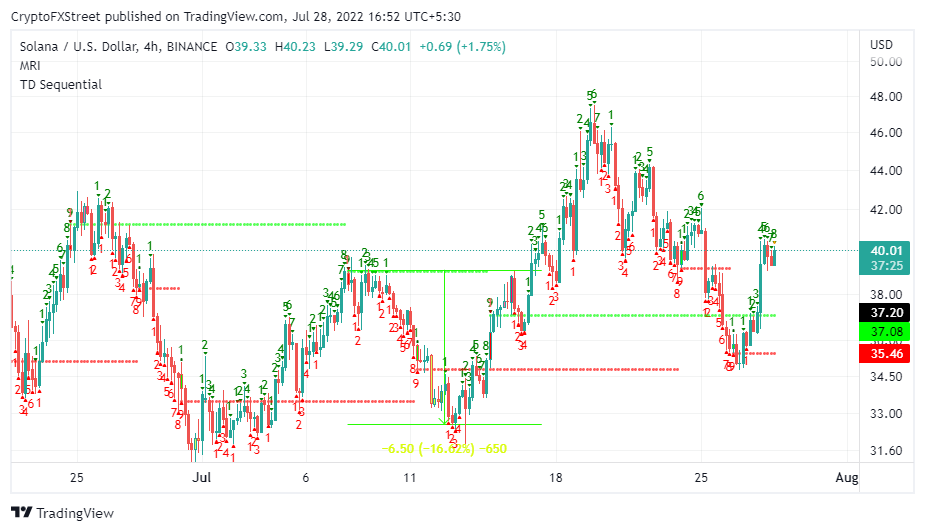
SOL/USD four-hour chart
As Solana price tries to build momentum, some hurdles, like the incoming sell signal from the TD Sequential indicator, could prove challenging to maneuver. Traders may be encouraged to book early profits by the formation of a green nine candlestick. This rise in overhead pressure could see SOL sliding to retest the support at $34.77. The last time such a sell signal was presented on July 8, Solana price plunged 16% from $39.10 to $32.60.
Author

John Isige
FXStreet
John Isige is a seasoned cryptocurrency journalist and markets analyst committed to delivering high-quality, actionable insights tailored to traders, investors, and crypto enthusiasts. He enjoys deep dives into emerging Web3 tren


