Here is not one but three reasons why Solana price could revisit $25
- Solana price looks ripe for a reversal from a liquidity objective perspective.
- Rejection at $44.37 further enforces the idea and forecasts a move to $24.52, with pit stops at $31.66 and $38.22.
- A daily candlestick close above $47.43 will invalidate the bearish thesis for SOL.

Solana price shows an interesting outlook that could be interpreted as exhaustion of the bullish regime and the potential start of a bearish reign. Investors can await confirmation or hop on the reversal trend early.
In this article, we will explore three reasons why SOL is ready for a retracement.
Solana price, liquidity pools and the hurdles it faces
Solana price rallied a whopping 45% between July 13 and July 19 after tagging the $31.66 support level for the third time. This run-up spiked above the $44.37 intermediate resistance barrier and the June 6 swing high at $44.90, collecting the buy-stop liquidity resting above it.
The first reason is basically the liquidity run, which is apparent. The second reason is the presence of the $44.37 resistance level, which makes it all-the-more compelling for SOL to reverse.
That said, investors need to observe that there is more buy-stop and sell-stop liquidity present on both sides. Even if the bulls fight with all their might, a retest of $47.43 seems plausible but a flip of the same level is highly unlikely.
Hence, a reversal in the direction is the next course of action for Solana price.
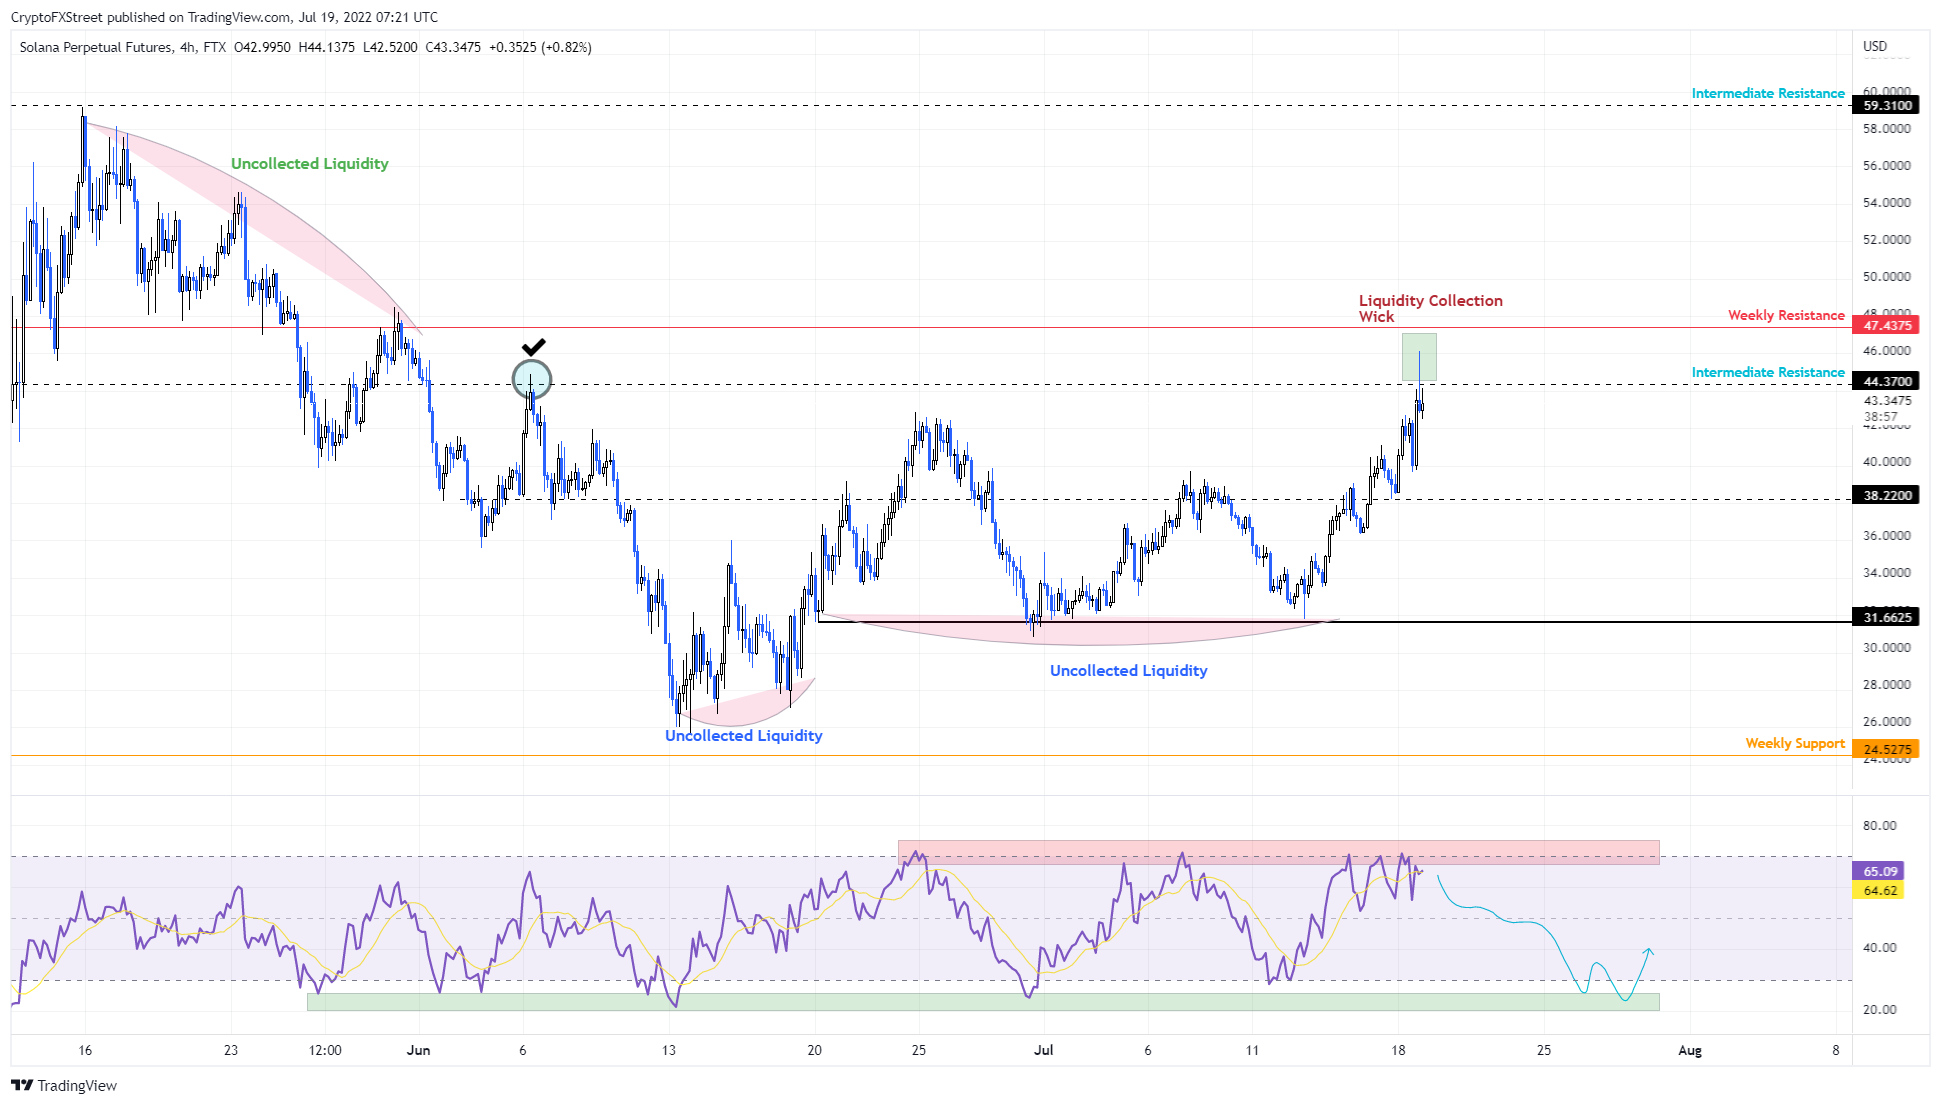
SOL/USDT 4-hour chart
Further adding credence to this outlook is the Relative Strength Index (RSI). This momentum indicator is used to assess the market sentiment and it shows that Solana price is above 70, aka the overbought level.
The last three times SOL rallied, the RSI hit a blockade around the 70-level and found support around the 30-level. There is no proof that this trend will not continue. Therefore, assuming a rejection at the current level ensues, investors can expect Solana price to collapse from the current level, bringing the RSI down with it.
Bitcoin price and its influence on SOL
Bitcoin price is currently facing the 200-week Simple Moving Average (SMA) at $22,559. Assuming BTC faces rejection at this level, Solana price is going to follow suit. In such a case, investors can expect the altcoin to lose its market value to panicking investors scrambling to book profits.
This situation could see Solana price retest the $38.22 support level, beyond which, SOL could slide to revisit the $31.66 foothold and sweep below it and collect the sell-stop liquidity.
In some cases, Solana price might even retest the $24.52 weekly support floor to collect the liquidity resting below the lows formed between June 13 and June 18. This move, in total, would constitute a 44% downswing.
Opposing view
While things might look logical from a technical point of view, investors need to note that if Bitcoin price overcomes the 200-week SMA, there will be trouble for bears.
This move would not just cause bears to panic, but it will also pose the threat of them getting liquidated. If Solana price produces a daily candlestick close above the $47.73 resistance barrier and flips it into a support floor, it will invalidate the bearish thesis described above.
Such a development could see SOL climb to $59.31.
Author

Akash Girimath
FXStreet
Akash Girimath is a Mechanical Engineer interested in the chaos of the financial markets. Trying to make sense of this convoluted yet fascinating space, he switched his engineering job to become a crypto reporter and analyst.



