Hedera Hashgraph price eyes 10% losses amid long HBAR liquidations on Binance
- Hedera Hashgraph price trades with a bearish bias, looking at more losses before a possible trend reversal.
- HBAR could drop almost 7% to the $0.057 support level before a possible correction.
- The bearish narrative will be invalidated upon a decisive candlestick close above the 200-day EMA at $0.068.
Hedera Hashgraph price (HBAR) was bearish across February into the first week of March before a bullish resurgence inspired hope among investors. In its recovery attempt, however, HBAR price faced much resistance as overhead pressure built up, and now the Exponential Moving Averages (EMA) have the Hashgraph technology token suppressed.
Hedera Hashgraph price drops amid Binance liquidations
Hedera Hashgraph price is $0.061 at the time of writing, after losing almost 3% in the last 24 hours. Based on CoinMarketCap data, HBAR trading volume is up almost 10%, with Coinalyze showing surging liquidations on the Binance exchange.
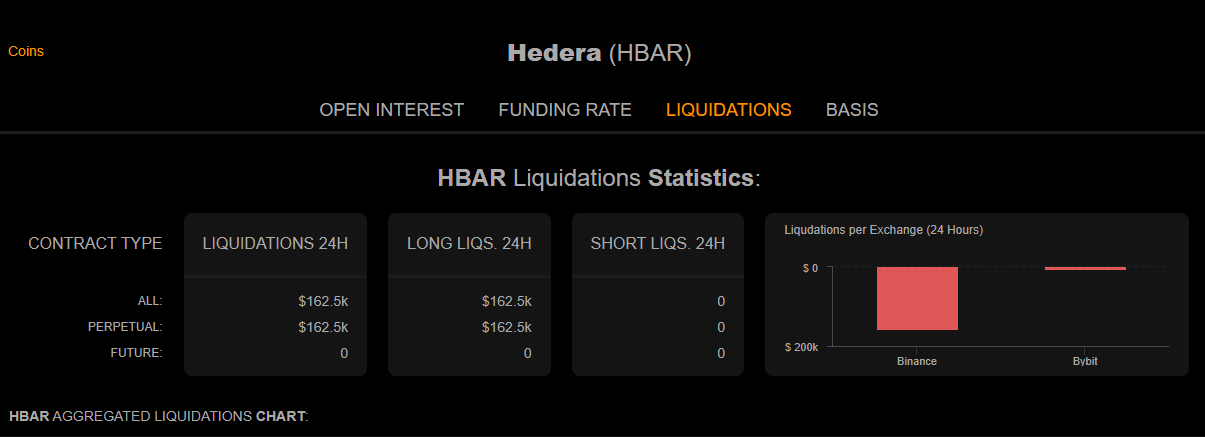
Based on the data, Binance is recording the highest liquidation for HBAR token, which explains the steady decline in Hedera Hashgraph price.
Long liquidation spotted on Binance usdⓢ-m $HBAR.
— CNGG - Liquidation Detector (@LiquDetector) April 20, 2023
$90,146.20$ market sold at 0.06108$. ⬇️
At the time of writing, Coinalyze shows up to 156,790 total liquidations, but the number keeps changing as CoinMonitor recorded 178,500 earlier on Thursday.
$178.5K $HBAR SHORTED @$0.062029 BINANCE SPOT
— TheCoinMonitor (@TheCoinMonitor_) April 20, 2023
Sentiment:
1H: Bullish
Liquidation of an asset defines turning the asset into cash, hence selling. It is a bearish force indicating that Binance is closing traders’ leveraged positions, presumably because they (traders) have insufficient funds to keep a leveraged trade open.
Hedera Hashgraph price could drop 10%
Hedera Hashgraph price could drop an additional 10% if the bearish momentum ensues. Such a move could send HBAR to find support around the $0.057 level. In highly bearish cases, the altcoin could extend a leg down to tag the $0.046 support level, marking a successful retest of the mid-November to mid-December lows.
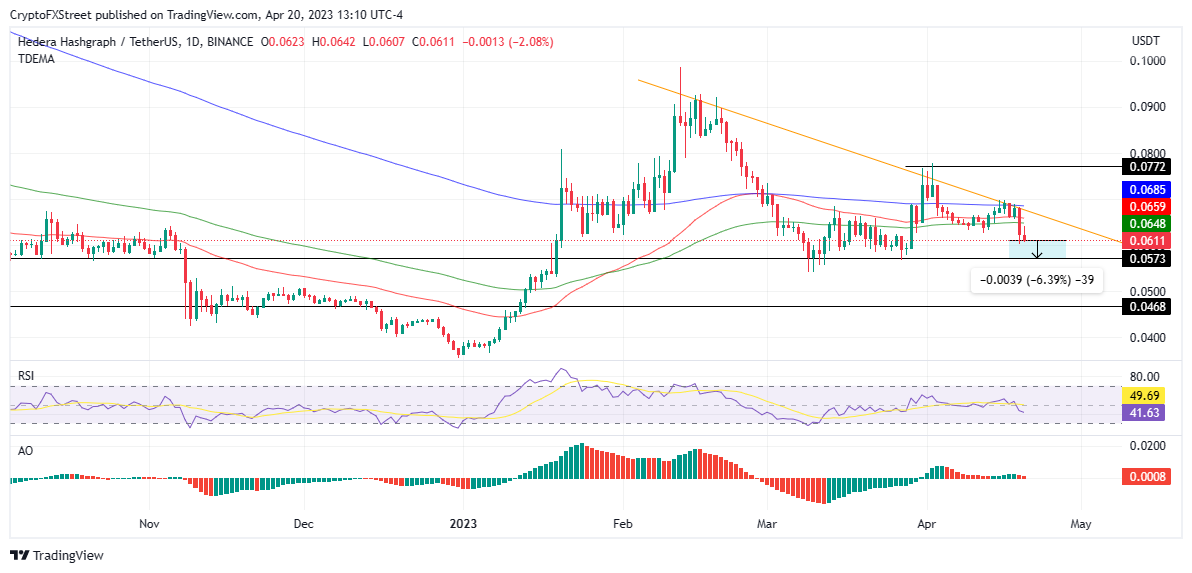
HBAR/USDT 1-day chart
Conversely, if buyer momentum takes form, Hedera Hashgraph price could rise to confront supplier congestion zones due to the 100-, 50-, and 200-day EMAs at $0.064, $0.065, and $0.068 levels, respectively. Notably, the bearish case will be invalidated once HBAR makes a decisive candlestick close above the 200-day EMA, marking a successful escape above the downtrend line.
Above the bearish zone, the Hedera Hashgraph price could extend a neck high to tag the $0.077 resistance level, but this would be in extremely bullish cases. Nevertheless, such a move would denote an uptick of around 25% from the current price of $0.061.
Author

Lockridge Okoth
FXStreet
Lockridge is a believer in the transformative power of crypto and the blockchain industry.


