Greed among cryptocurrency investors soars to the highest level ever recorded
- The cryptocurrency fear and greed index is at record highs as a massive correction looms.
- The TD Sequential indicator's Sell signals on the 3-day and weekly charts suggest that the headwind on Bitcoin is intensifying.

The cryptocurrency market has been on a consistent and remarkable rally since the beginning of November. Most cryptoassets are trading at levels not seen since 2017 and early 2018. Bitcoin, for instance, rocked to $19,500 before retreating to slightly under $18,000.
Bullish markets are usually characterized by uncalculated speculation and even greed. As the prices rally, investors tend to enter the market, hoping that the bull cycle will continue to undefined levels, as discussed earlier this week. Sudden price corrections are also common and leave many investors bleeding profusely.
Cryptocurrency participants are overwhelmingly bullish
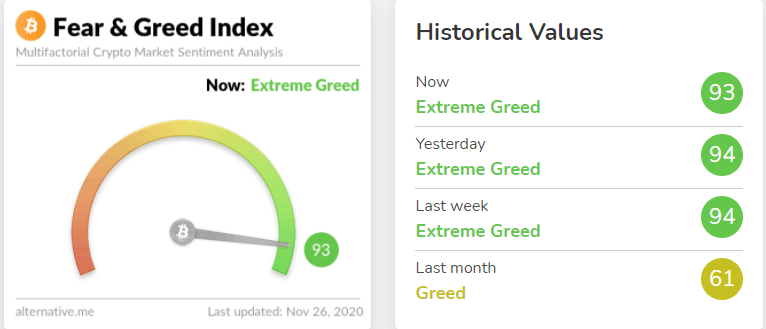
The cryptocurrency fear and greed index (CFGI) by Alternative.me is currently at record highs, suggesting that the traders and investors in the crypto market are incredibly bullish. This index functions due to the emotional behavior of participants in the cryptocurrency market.
Investors get greedy during bullish markets, mainly due to the fear of missing out (FOMO). On the other hand, people panic sell their assets when the crypto market begins to dot red.
Alternative.me's CFGI has been designed to crunch the numbers on a scale running from zero to 100. Zero represents "extreme fear" and suggests that prices are about to start pumping, offering an opportunity to buy. Similarly, 100 represents "extreme greed," implying that the market is about to correct.
Crypto CFGI chart
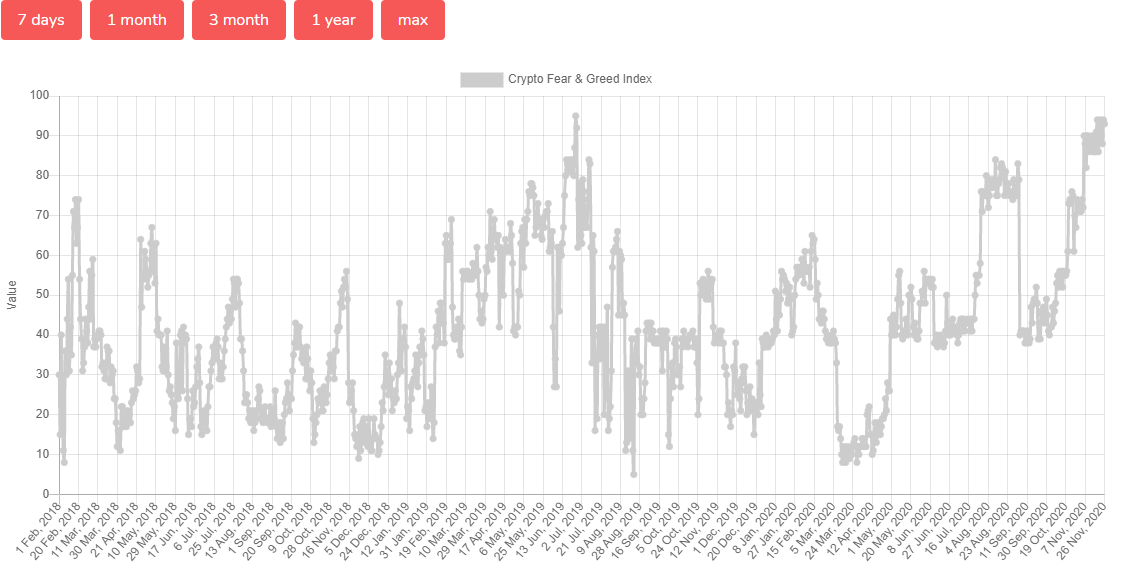
Looking at the CFGI from January 2018, towards the end of the parabolic rally in 2017, the agreed level of 63 in February 2018 saw the entire market start to fall. Bitcoin dived to levels close to $5,800 before a recovery came into the picture supported by a CFGI fear value of 22. The flagship cryptocurrency soared to highs above $10,000 towards the end of April 2018.
Consequently, the index hit a record high in June 2019 (extreme greed: 95). At the time, Bitcoin had recovered from the lows recorded in November 2018 near $3,100 and exchanged hands roughly at $13,800.
A correction ensued, sending Bitcoin to the March 2020 lows at $3,800. The 2020 low was marked by a CFGI extreme fear value of 11. This presented a massive buy opportunity across the market, culminating in the ongoing bull cycle.
CFGI historical chart
At the time of writing, the CFGI extreme greed value is holding the ground at 95. The metric implies that a correction is likely to come into the picture. Therefore, there is a need for investors to proceed with caution to avoid massive losses.
Bitcoin is on the verge of a significant correction
The TD Sequential indicator has presented a couple of sell signals on the 3-day and weekly charts. The signals manifested in green nine candlesticks are likely to be validated, especially now that Bitcoin has been rejected from $19,500.
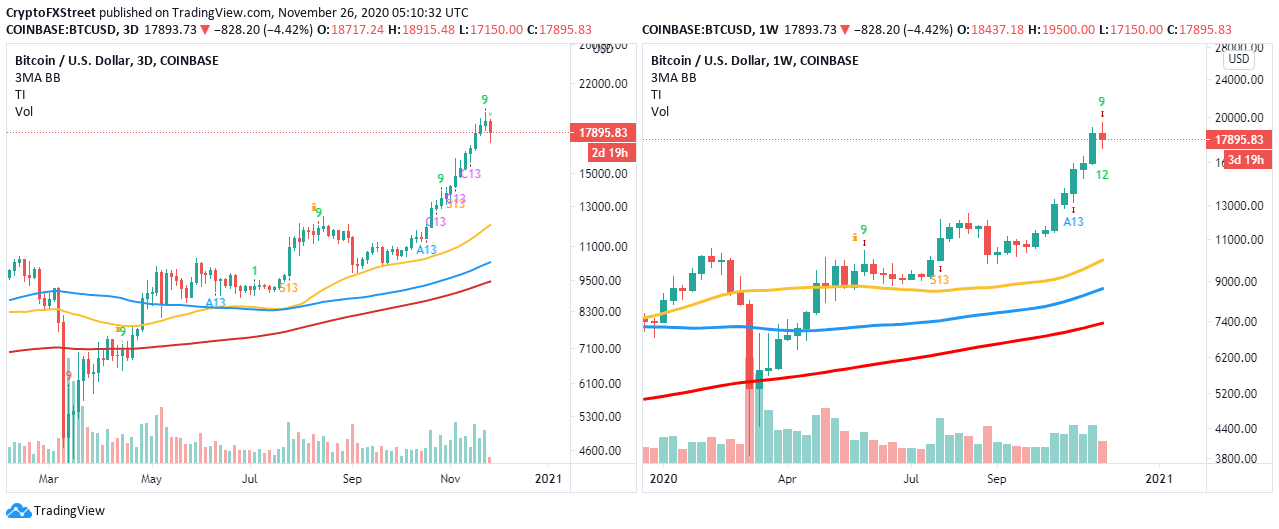
BTC/USD 3-day and weekly charts
The flagship cryptocurrency has slipped under $18,000 after failing to find higher support. Selling pressure is likely to increase, exclusively with the CFGI at all-time highs.
Investors are likely to start cashing out in a bid to take profits before BTC drops further. Panic selling could be the final blow to Bitcoin, as it would drive prices to the 100 Simple Moving Average currently at $12,000.
Author

John Isige
FXStreet
John Isige is a seasoned cryptocurrency journalist and markets analyst committed to delivering high-quality, actionable insights tailored to traders, investors, and crypto enthusiasts. He enjoys deep dives into emerging Web3 tren


