Fourteen thousand dollar in view for bitcoin in 2020

Bitcoin had been on an upswing this year before the pandemic began. The sharp corrective move started at the end of February when COVID-19 started spreading throughout Europe and the USA. Had it not been for the new coronavirus infection, the world would have most likely seen Bitcoin reach $11,500 in April 2020.
Last week Bitcoin broke through the weekly resistance level at $11,507 set in July – August 2019. Currently, the only technical level for Bitcoin to break on its way to last year’s high at $13,957 is the 0.786 Fibonacci retracement level sitting at $11,820. If BTC finishes this week above it, seeing $14,000 per 1 BTC may be a matter of several weeks.
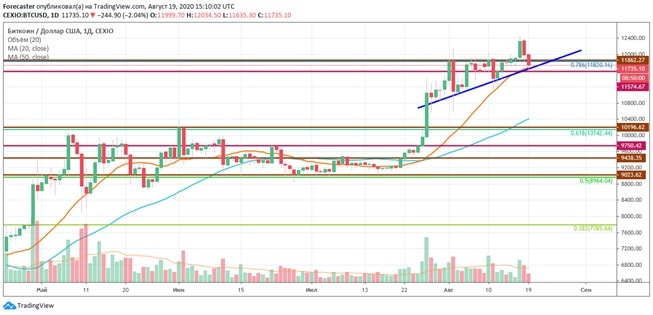
CEX.IO Daily BTC/USD chart on TradingView
We are now seeing a local upside move on the daily chart with Bitcoin edging higher, paving its way through the weekly resistance level at $11.762 and the daily one at $11,862. On top of it the daily level almost coincides with the 0,786 Fibonacci level, which makes the $11,800 zone quite a crucial one for understanding Bitcoin’s next big move. If the asset manages to continue its steady ascent on the daily chart, following the bottom trend-supporting line (the blue one), the resistance will become the support. In this case, there is no major resistance on the chart for Bitcoin until its historical high.
However, we should likewise pay attention to the fundamental components of the market, not dismissing traditional financial sectors. Looking at the risk-rich market assets more globally, we can see the stocks recovering at a good pace. As for potential benefits for Bitcoin from that, it may stimulate additional influx of capital into digital gold as investors’ appetite for risk-heavy assets grows.
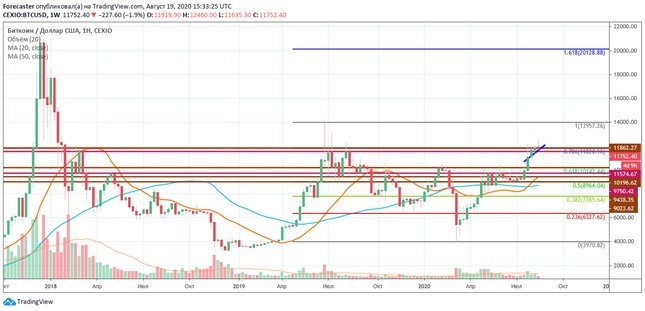
CEX.IO Weekly BTC/USD Chart on TradingView
With the Fibonacci retracement stretched from last year’s high to this year’s low, we can see that the 1.618 level indicates $20,128 as the target level. But that is yet too far to consider now.
Presently, for those who have invested in Bitcoin to wait patiently and see the market-dominant cryptocurrency go high in the long term and for those who are actively trading Bitcoin, this is a key moment for understanding whether it can make a considerable move upward in the near term. This August is likely to give us an answer to this question.
And again, because there is no pronounced technical resistance from the current daily resistance level at $11.862 right on to the historic high, we should all the more closely watch the BTC chart development right now. If the breach is made soon, $14,000 per 1 BTC is more than real before the end of 2020, and much more may lie ahead since simply a trend is always a trend.
Author

Konstantin Anissimov
CEX.IO
Konstantin is a businessman with skills in corporate governance, strategic management, customer relations, partnership negotiations and international sales. Graduated the Executive MBA program at the University of Cambridge.



