Floki price eyes rally following liquidity sweep
- Floki price is approaching the bottom of the rising trendline, a key support level from which it is likely to rebound.
- On-chain data suggests that FLOKI’s development activity is rising, a bullish sign.
- A daily candlestick close below $0.000193 would invalidate the bullish thesis.
Floki (FLOKI) price could experience a nearly 30% rebound in the short-to-medium term, according to technical indicators and on-chain metrics, as the meme coin heads towards a key level that has previously acted as a support and amid a rise in development activity.
Floki price seems set for liquidity sweep
Floki price crashed more than 10% on Tuesday as it broke its previous support level at $0.000258. Currently, its price is heading towards the bottom of the rising trend line, which has previously acted as support.
Floki price – and more broadly, the cryptocurrency market – is likely to be volatile ahead of today's US Consumer Price Index (CPI) release for May and the US Federal Reserve (Fed) decision on interest rates. These key events for financial markets could trigger Floki to sweep out buy-side liquidity before rallying upside.
- In such a scenario, Floki could first crash up to 14% from its current price level of $0.000233 to find support on the following levels.
- The support zone extending between $0.000221 and $0.000211.
The 61.8% Fibonacci retracement level at $0.000201, drawn from a swing low of $0.000110 on April 13 to a swing high of $0.000348 on June 5, which roughly coincides with the rising trendline.
If FLOKI bounces off $0.000201, it could rally 29% to reach its previous resistance level of $0.000258.
If the overall crypto market outlook is positive due to favorable US economic data release, Floki could extend the rally to its next resistance level at $0.0.000348, constituting an additional 35% gain.
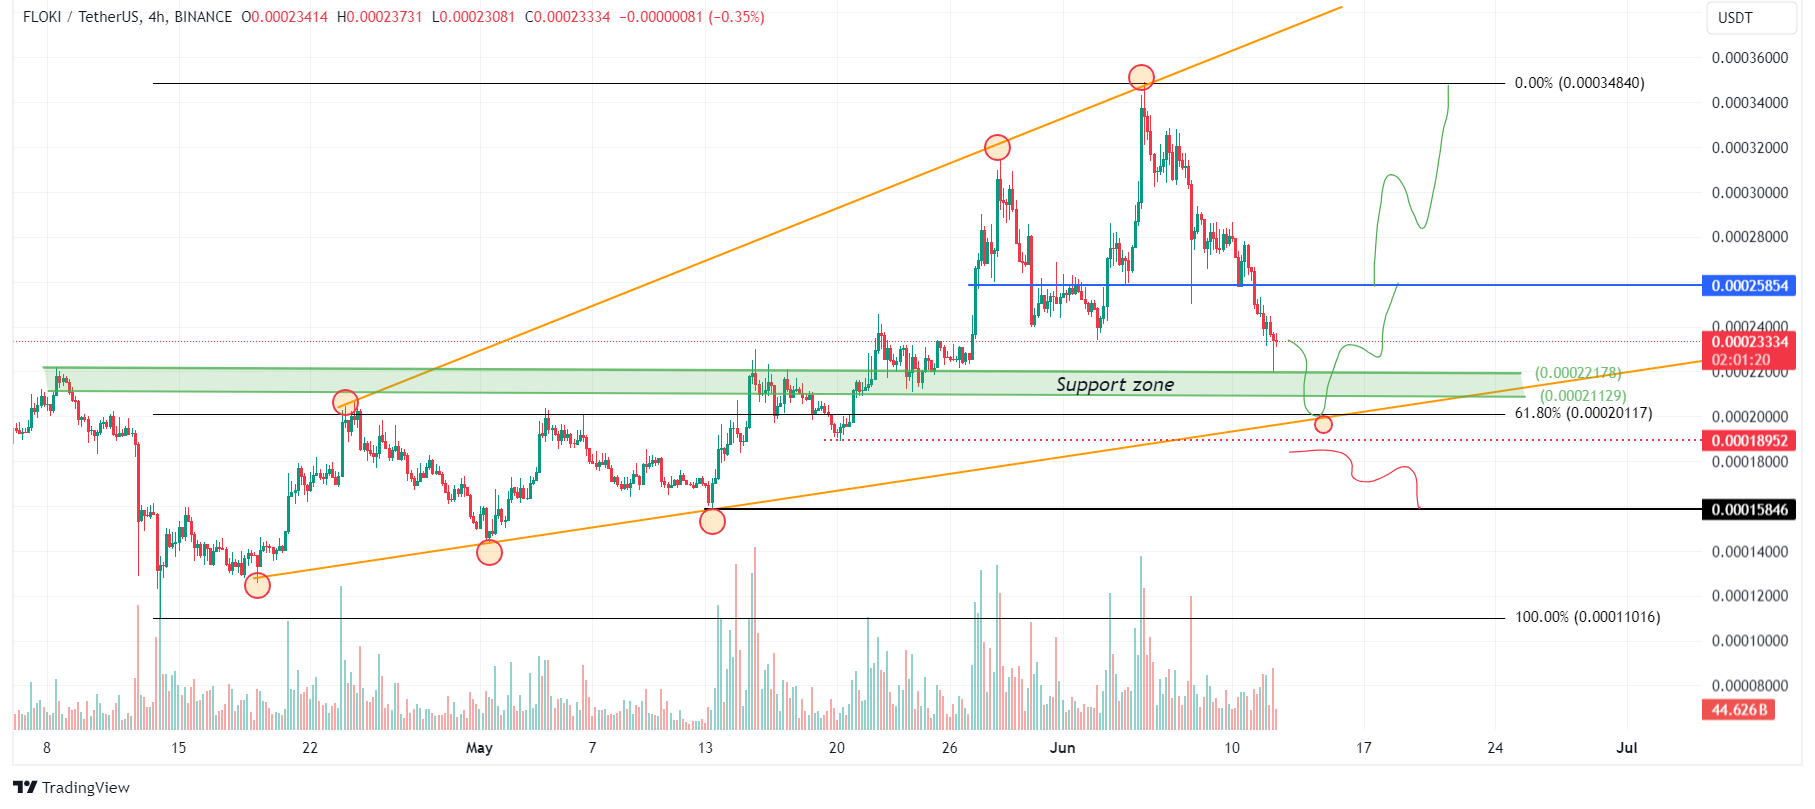
FlOKI/USDT 4-hour chart
Based on IntoTheBlock's In/Out of the Money Map (IOMAP), nearly 1,280 addresses accumulated 203.33 billion FLOKI tokens between $0.000226 and $0.000232, making this area a key support zone.
Interestingly, the $0.000221 to $0.000211 zone mentioned from a technical analysis perspective coincides with the IOMAP findings, making this zone a key reversal zone to watch.
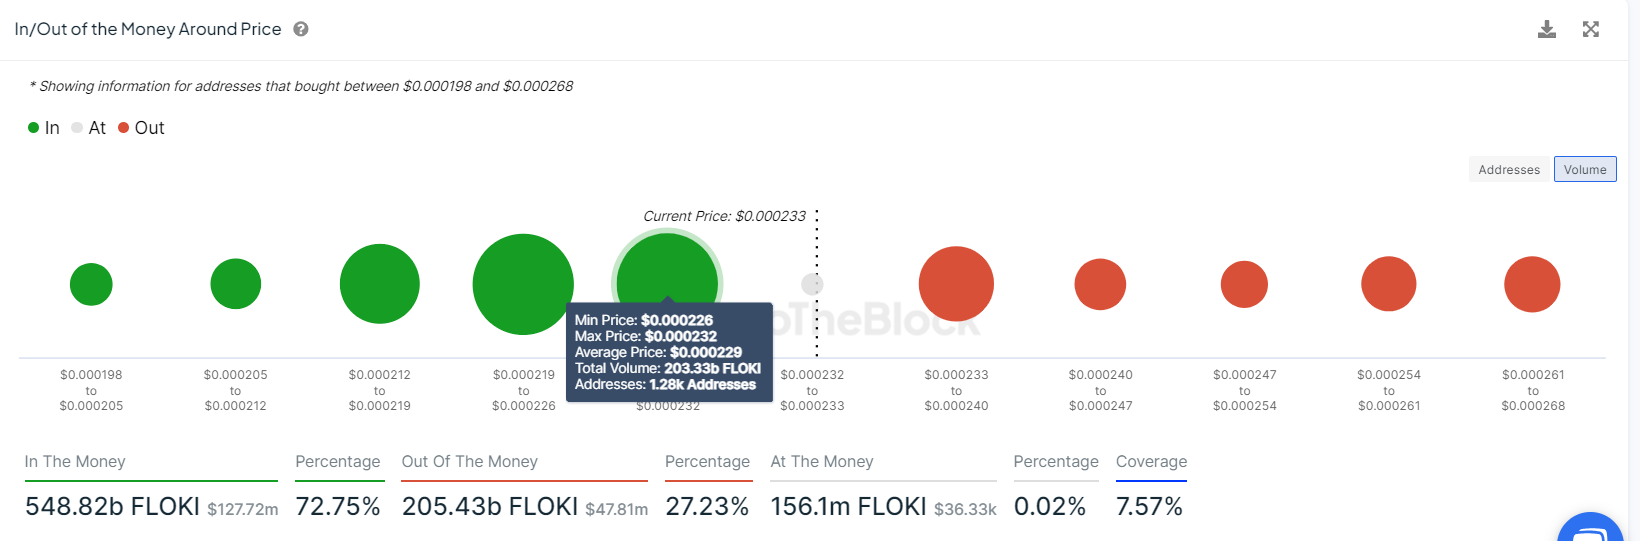
FLOKI IOMAP chart
Santiment’s Development Activity metric tracks the frequency of project development events recorded in the public GitHub repository over time.
A rise in this metric usually suggests continuous endeavors to uphold, innovate, and improve the protocol, which is generally seen as favorable by investors and stakeholders. Conversely, a decline in the metric might raise apprehensions about the project's endurance, capacity for innovation, and engagement with the community in the foreseeable future.
As in Floki’s case, the index rose from 0.476 on June 6 to 0.714 on June 11. The 50% rise in Floki's Developing Activity adds further credence to the bullish outlook.
%20[10.41.04,%2012%20Jun,%202024]-638537743252786907.png)
FLOKI Development Activity chart
Despite the bullish thesis signaled by both on-chain data and technical analysis, if the FLOKI daily candlestick closes below the May 20 low at $0.000189, the outlook will shift to bearish. This scenario could lead to a 16% crash to $0.000159, the swing low of May 13.
Author

Manish Chhetri
FXStreet
Manish Chhetri is a crypto specialist with over four years of experience in the cryptocurrency industry.


