- Fantom price shows a consolidation below a trend line connecting the lower highs produced since May 23.
- A breakout from this setup could result in a minor move to $0.317, but depending on the momentum, FTM could even rally 170%.
- A daily candlestick close below $0.177 will invalidate the bullish thesis.
Fantom price clearly shows consolidation as it hovers above a support level but below a multi-month trend line. A decisive move above this declining resistance level will signal a breakout and trigger a massive run-up for FTM.
Fantom price remains undervalued
Fantom price has produced three distinctive lower lows since May 23, denoting persistent sellers. This could be due to the market conditions or just investors offloading their holdings in hopes of a better discount. Regardless, FTM has been stuck below this downtrend for roughly seven months.
The Relative Strength Index (RSI) shows that it has finally breached the midpoint at 50, indicating a resurgence of buyers. This move pushed Fantom price by 55% in just ten days, hinting that the buyers’ appetite is strong. A pullback in FTM to roughly retest the $0.208 support level will knock RSI down to retest the 50-level again. Such a development could reset the bullish momentum, allowing the buyers to make a comeback.
Therefore, the range between $0.233 and $0.208 is the best place to accumulate FTM at a discount before it kick-starts its rally.
As for the upside target, Fantom price needs to bounce from the zone mentioned above and break out from the declining trend line. A successful hold above the $0.295 or $0.300 level will be a confirmation that the uptrend is progressing smoothly.
In such a case, the short-term targets will be $0.317 and $0.410. Beyond this hurdle, Fantom price could target the $0.654 barrier.
If FTM retests the $0.654 level, it will denote a 170% upswing from $0.233. From $0.208, however, this move would constitute a 214% gain.
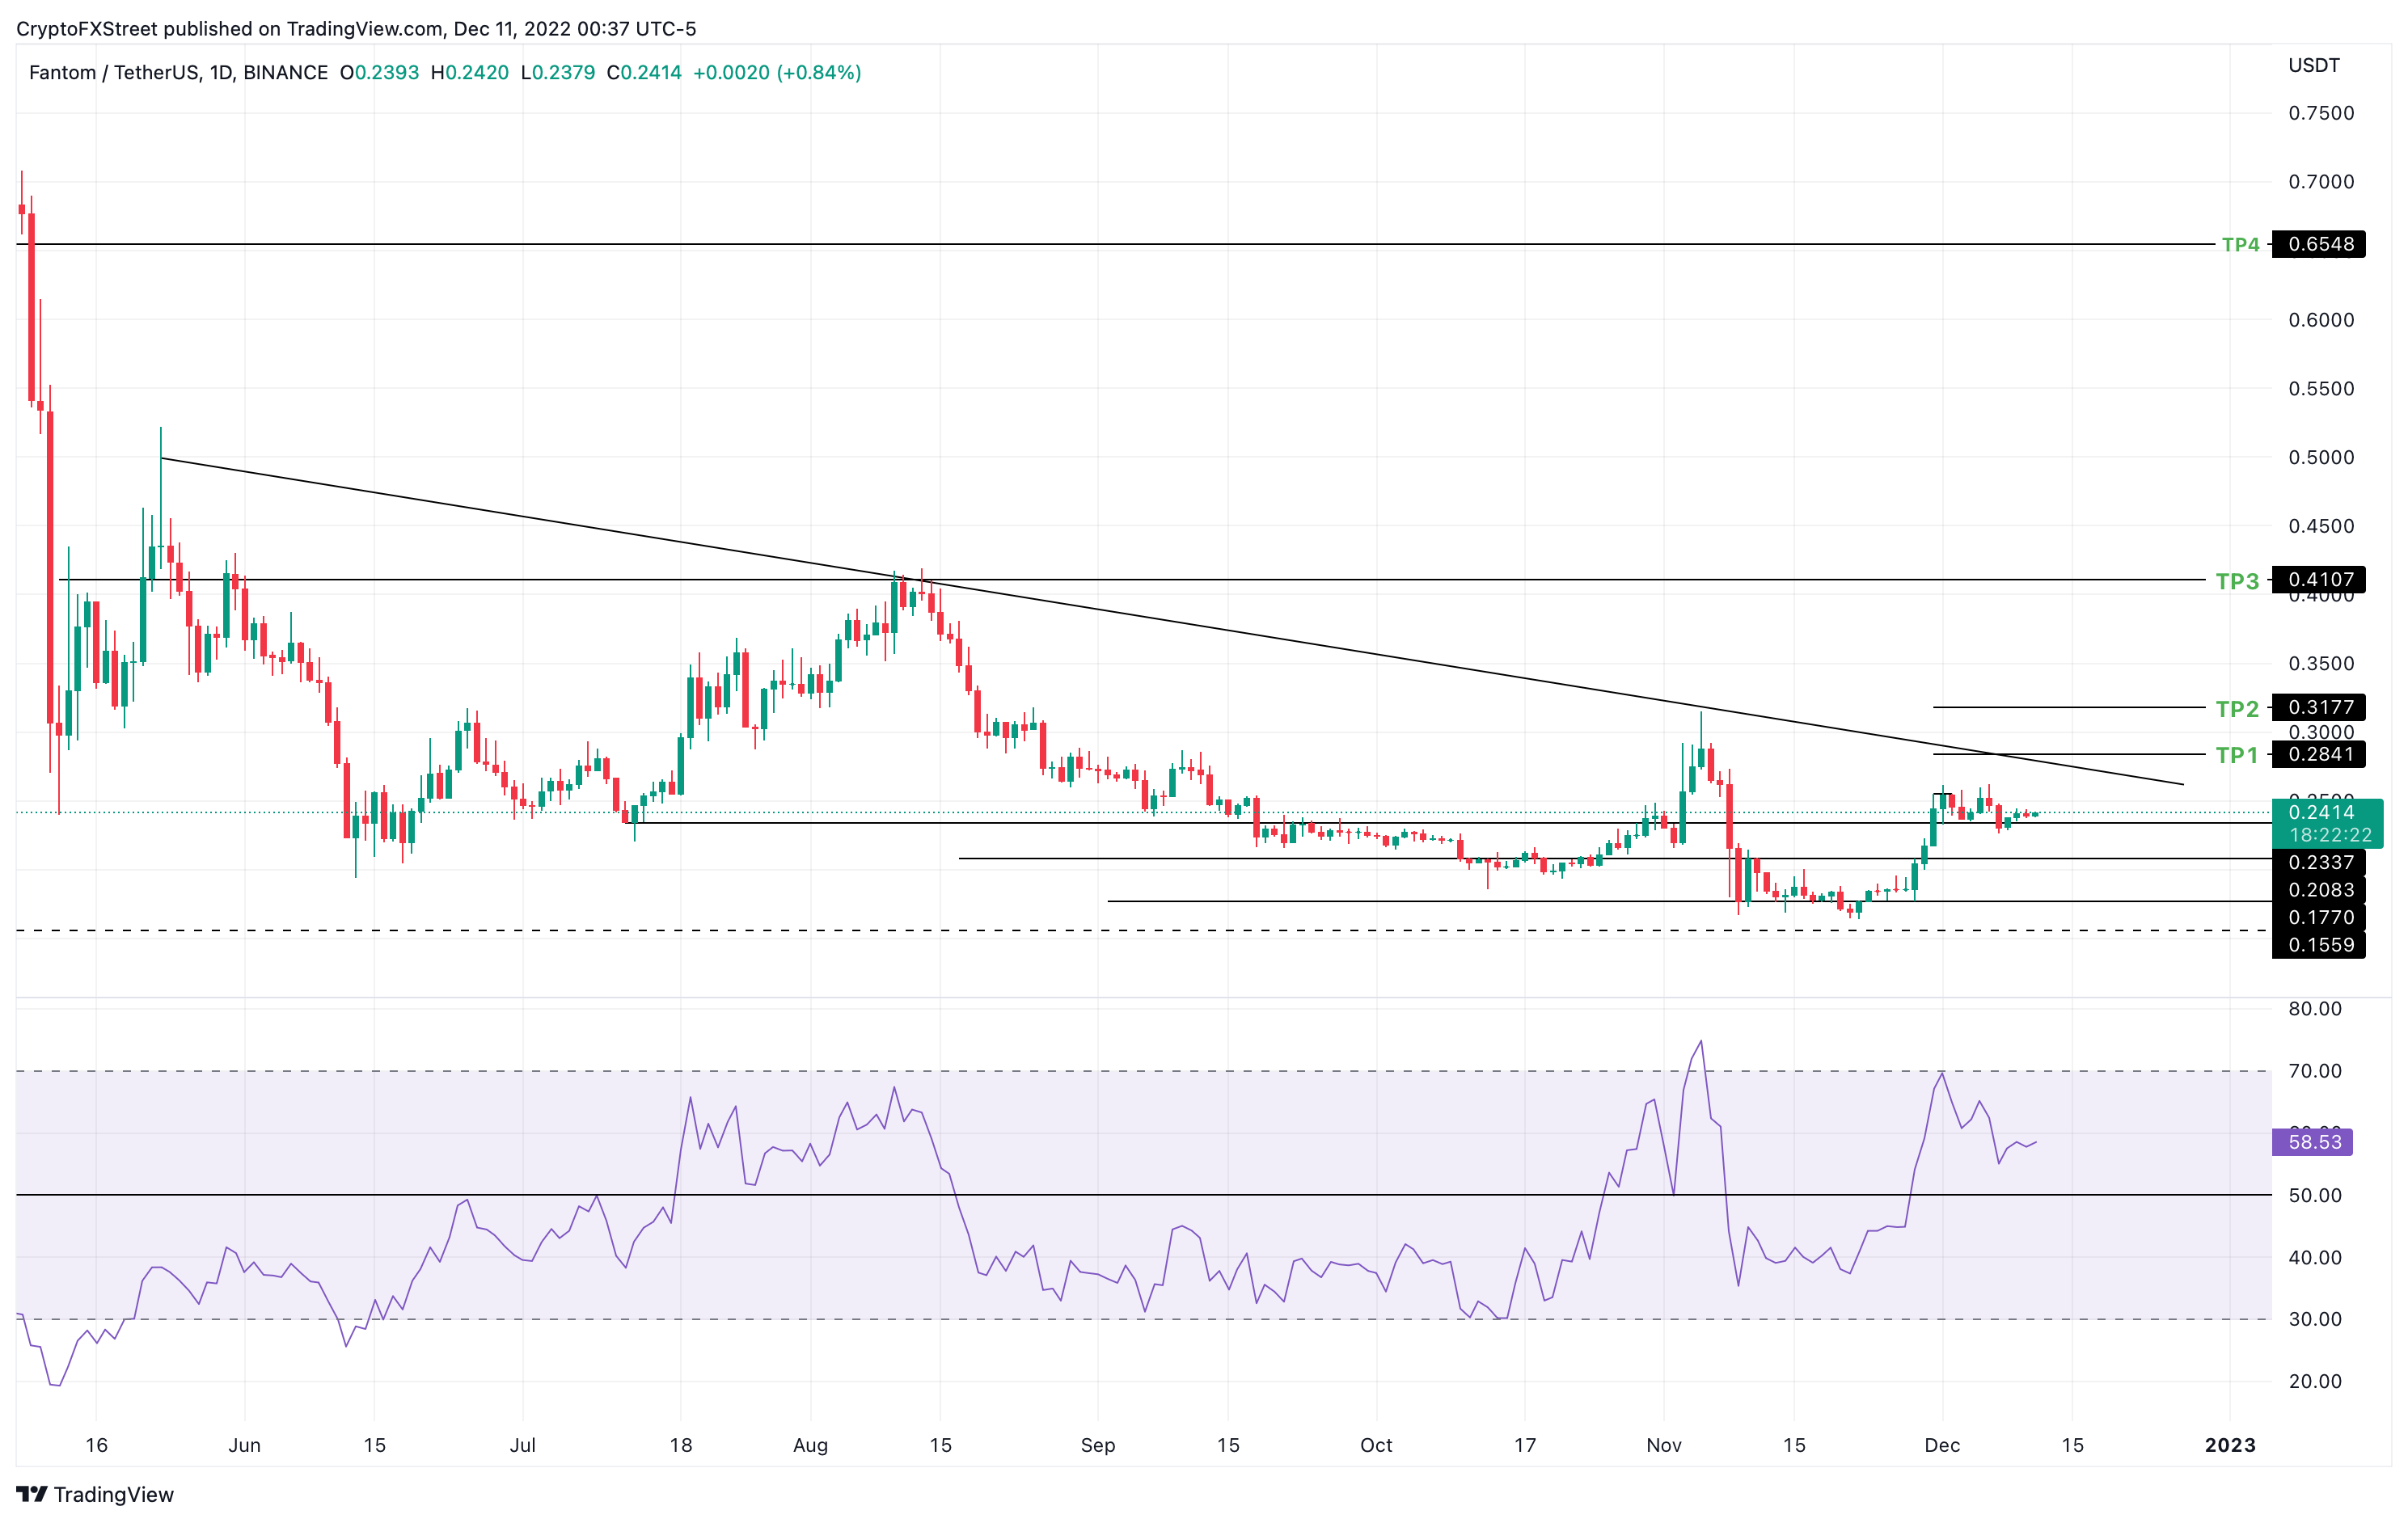
FTM/USDT 1-day chart
Regardless of the massively optimistic outlook from a technical standpoint, Fantom price must clear some significant hurdles. Even before that, FTM must hold above the $0.233 support level.
A failure to do so will knock the altcoin down to a $0.208 foothold, which could be another level to accumulate with higher rewards but relatively lower risk. The trouble for bulls will arrive if FTM produces a daily candlestick close below the $0.177 support level. This move will shake the belief among sidelined buyers and invalidate the bullish thesis.
This development could see Fantom price revisit the $0.150 level to recuperate.
This video shows how Bitcoin price moves could affect Fantom price
Information on these pages contains forward-looking statements that involve risks and uncertainties. Markets and instruments profiled on this page are for informational purposes only and should not in any way come across as a recommendation to buy or sell in these assets. You should do your own thorough research before making any investment decisions. FXStreet does not in any way guarantee that this information is free from mistakes, errors, or material misstatements. It also does not guarantee that this information is of a timely nature. Investing in Open Markets involves a great deal of risk, including the loss of all or a portion of your investment, as well as emotional distress. All risks, losses and costs associated with investing, including total loss of principal, are your responsibility. The views and opinions expressed in this article are those of the authors and do not necessarily reflect the official policy or position of FXStreet nor its advertisers. The author will not be held responsible for information that is found at the end of links posted on this page.
If not otherwise explicitly mentioned in the body of the article, at the time of writing, the author has no position in any stock mentioned in this article and no business relationship with any company mentioned. The author has not received compensation for writing this article, other than from FXStreet.
FXStreet and the author do not provide personalized recommendations. The author makes no representations as to the accuracy, completeness, or suitability of this information. FXStreet and the author will not be liable for any errors, omissions or any losses, injuries or damages arising from this information and its display or use. Errors and omissions excepted.
The author and FXStreet are not registered investment advisors and nothing in this article is intended to be investment advice.
Recommended Content
Editors’ Picks
Charles Hoskinson and XRP community in loggerheads again, debate on Ethereum’s free pass resurfaces

Charles Hoskinson, the founder of Cardano, engaged in a debate with the XRP community over the rumors of ConsenSys founder, Joseph Lubin, bribing the US financial regulator.
Bitcoin Weekly Forecast: Analyzing potential $30k corrections ahead of BTC ETF approval

Bitcoin (BTC) price has slowed down its 2023 bull rally as it approaches the $37,000 level. After three weeks of consolidating around this level, BTC shows no directional bias whatsoever.
Solana likely to extend gains as DeFi airdrop season could boost user base

Solana ecosystem is set to experience a surge in activity from decentralized finance (DeFi) projects that offer users airdrops in the following months, according to a report from crypto market intelligence company Messari.
LUNC ranks among trending tokens alongside Dollar pegged stablecoin USTC, eyes recovery

Terra Classic USD and Terra Luna Classic tokens are trending among market participants after overnight price gains. USTC rallied to $0.078 local top after its 2022 collapse, garnering hope among traders.
Three key BTC accumulation levels before ETF approval in January 2024

Bitcoin, from a high time-frame perspective, has been in an up-only trend since the start of 2023. BTC has ignored many sell signals due to the likelihood of an Exchange-Traded Fund approval. With the holidays around the corner, falling liquidity could see BTC discounted from its current level, hovering around the $37,000 region.