Ethereum price tests January 2022 breakout and finds support, ETH to retest $3,200
- Ethereum price is now at its most vulnerable position since December 28, 2021.
- One final Ichimoku level preventing a total collapse of ETH must hold.
- Key resistance ahead must be broken to prevent a sell-off.

Ethereum price action has not been immune to the broader effects weighing on risk-on markets. Fears of an imminent invasion of Ukraine by Russia have sidelined many market participants or have scared off investors entirely. However, a new bull market and expansion move may be developing for ETH.
Ethereum price develops highly probable bear trap before returning to $3,200
Ethereum price action on its daily Ichimoku chart is, at first glance, ugly. ETH is below the Ichimoku Cloud, the Tenkan-Sen, and the Kijun-Sen. From an Ichimoku perspective, ETH is at the weakest and most bearish position since the Ideal Bearish Ichimoku Breakout was triggered on December 28, 2021.
The only Ichimoku indicator preventing a total collapse of Ethereum price is the Chikou Span, which is currently above the bodies of the candlesticks. If sellers push ETH to a close at or below $2,400, bears could probably push price to $2,000 or lower.
However, despite the near-term bearish outlook, Ethereum price completed a very standard and normal behavior: a retest of a breakout from a consolidation zone. The congestion zone between $2,300 and $2,600 (61.8% Fibonacci retracement) that existed between January 22, 2022, and January 31, 2022, was broken on February 1, 2022.
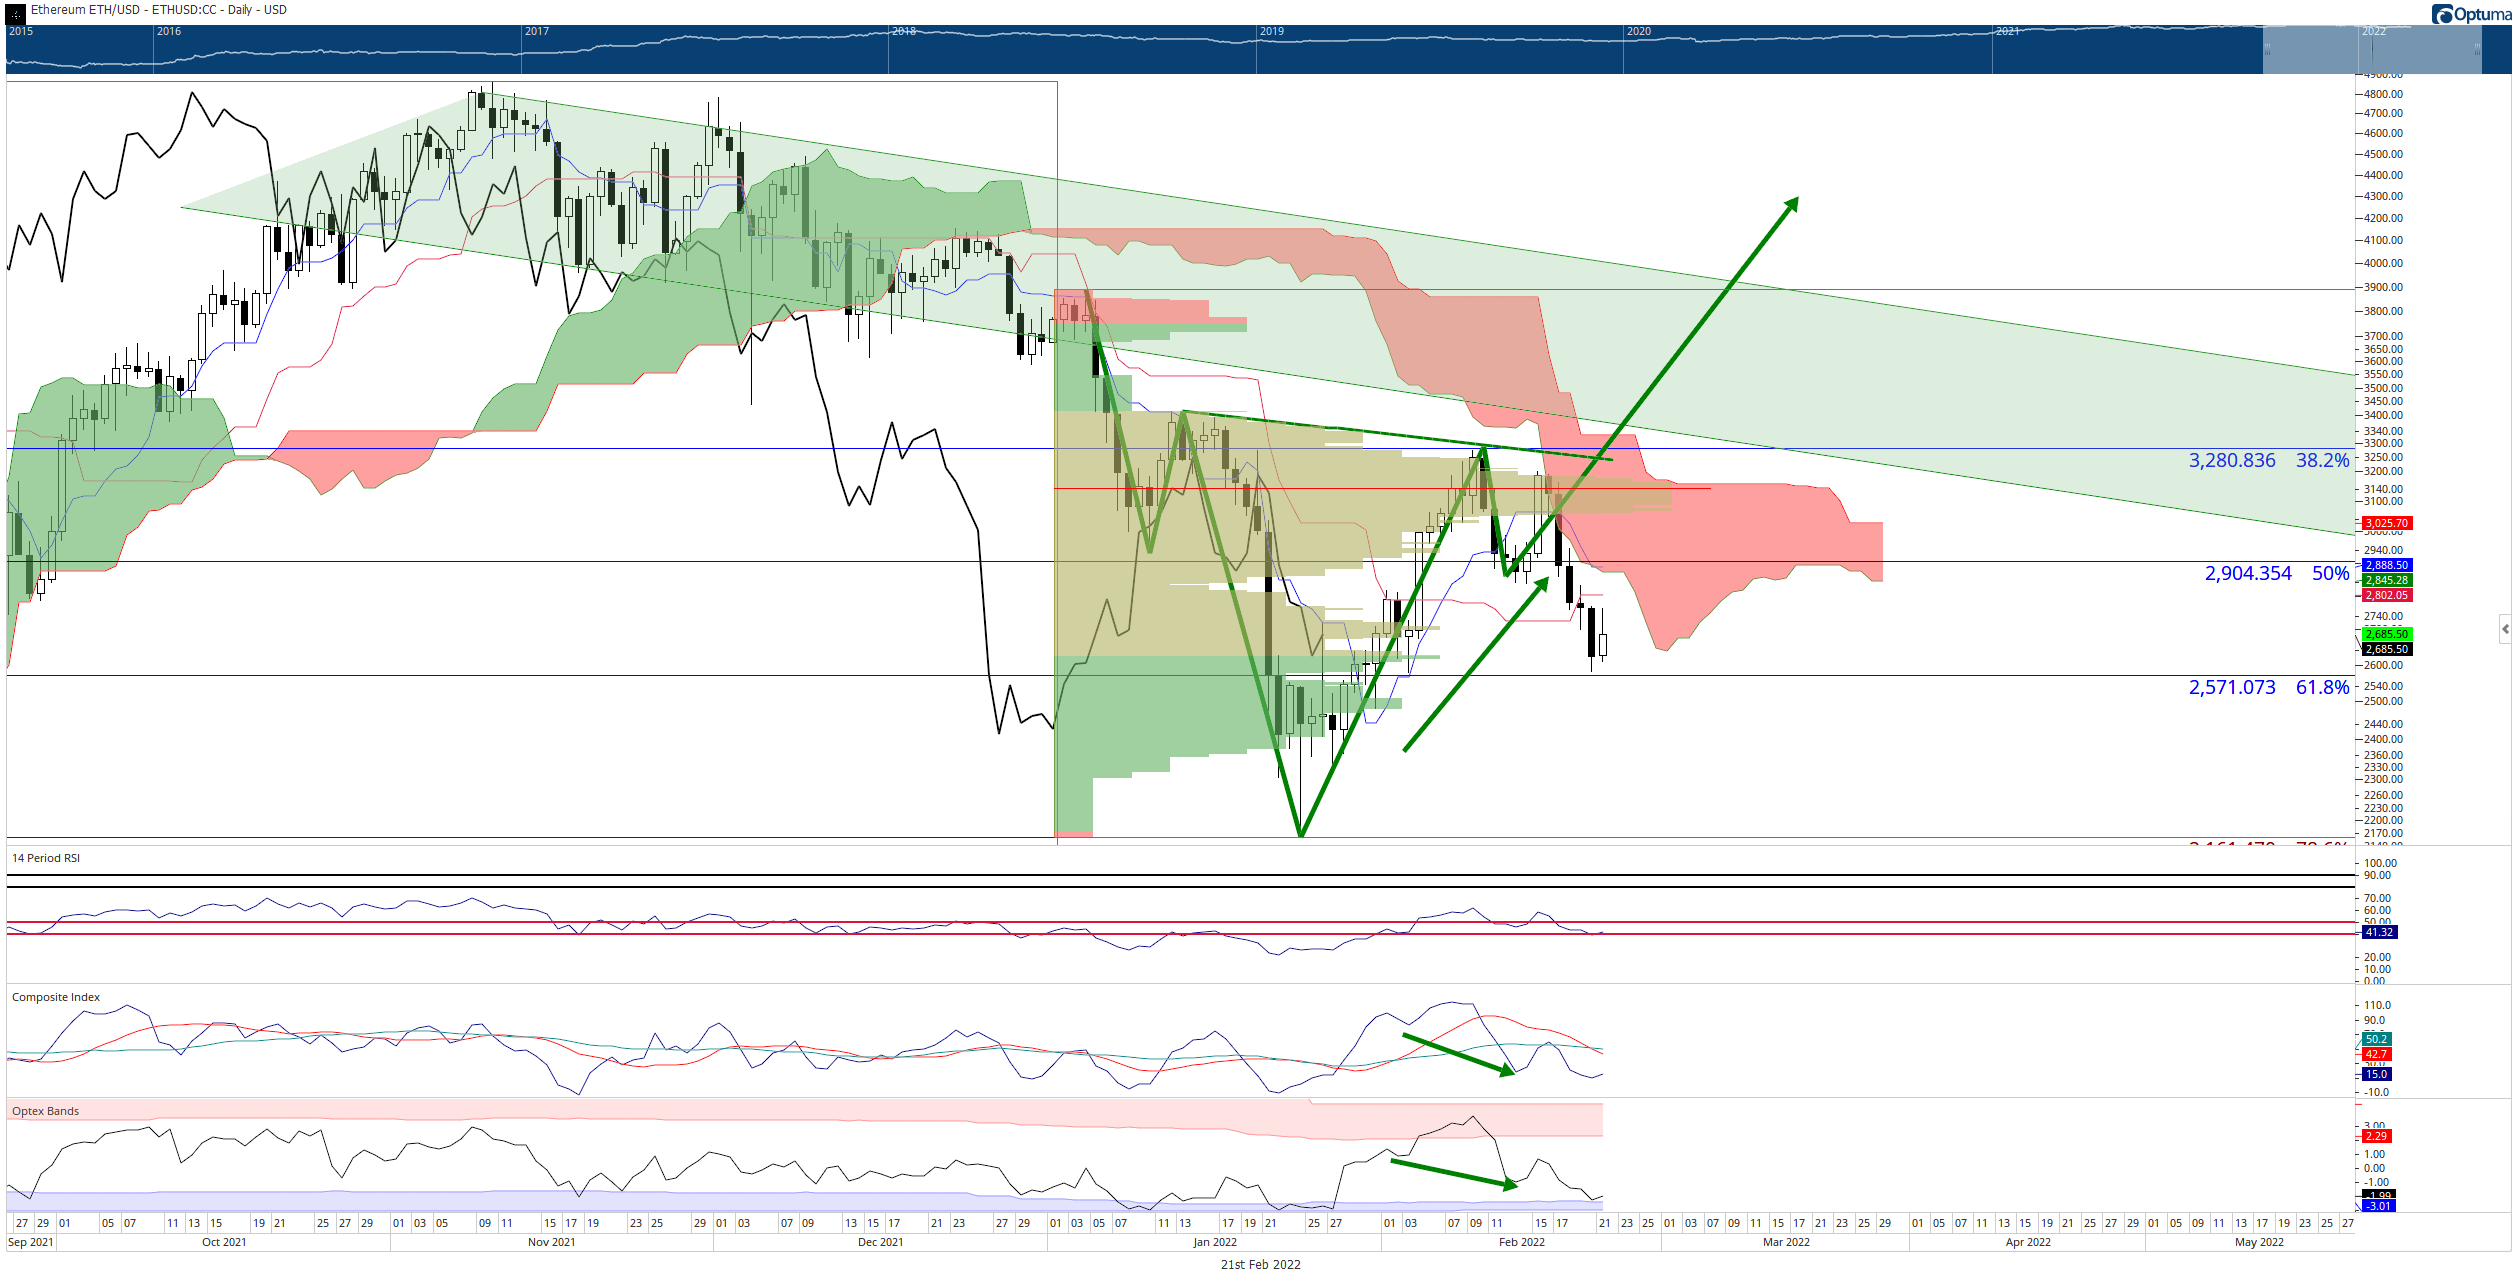
ETH/USD Daily Ichimoku Kinko Hyo Chart
Sellers retested the former resistance level turned support at $2,600, but buyers stepped in and prevented further losses – for now. However, Ethereum price must return to at least the 50% Fibonacci retracement at $2,900 to prevent further bearish price action and position Ethereum for another run towards the $4,000 value area.
Author

Jonathan Morgan
Independent Analyst
Jonathan has been working as an Independent future, forex, and cryptocurrency trader and analyst for 8 years. He also has been writing for the past 5 years.



