Ethereum price reaches initial target, but ETH rebound is more than a dead cat bounce
- Ethereum price locked between the 50-day simple moving average (SMA) and the 200-day SMA.
- The 2020 ascending trendline has become support again after failing on July 13.
- The four-day Rate of Change (ROC) reaches 22%, slightly below the rebound at the end of June.

Ethereum price reached the initial price target at the union of the 200-week SMA with the 2020 ascending trend line and the 50-day SMA. Today’s weakness is an obvious outcome and follows a bearish momentum divergence on the four-hour chart. ETH still has further upside potential if the February high of $2,041 holds strong on price weakness.
Ethereum price juggles resistance levels
Ethereum price successfully tested the outstanding support around $1,700, formulated by the May 23 low of $1,728, the June 22 low of $1,700, the June 26 low of $1,717 and the 61.8% Fibonacci retracement of the ETH rally beginning in March 2020 at $1,730. The average of the four levels was $1,719, and the July 20 low was $1,718.
The ETH rebound over the four days following the July 20 low lifted Ethereum price 22% before striking resistance at the 50-day SMA at $2,176. Compared to the previous three bounces since the May crash, this four-day rebound falls short of the late June jump of 24.47% and the late May spike of 30.76% but bests the 19.64% move at the beginning of June.
In the previous three instances, the moves proved to be dead cat bounces as ETH quickly turned lower. Now, the question becomes whether this 22% rally is the beginning of a meaningful Ethereum price advance that will surpass the descending channel’s upper resistance line, currently at $2,477, or is just another dead cat bounce in the larger corrective process.
Critical to the bullish ETH narrative is a weekly close above the 2020 ascending trend line, now around $2,130. Better still is a weekly close above the 50-day SMA at $2,166. It would be the first confirmation of a trend change and raise the probability that Ethereum price is poised to target the channel’s upper resistance line at $2,477, leading to a 16% gain from ascending trend line.
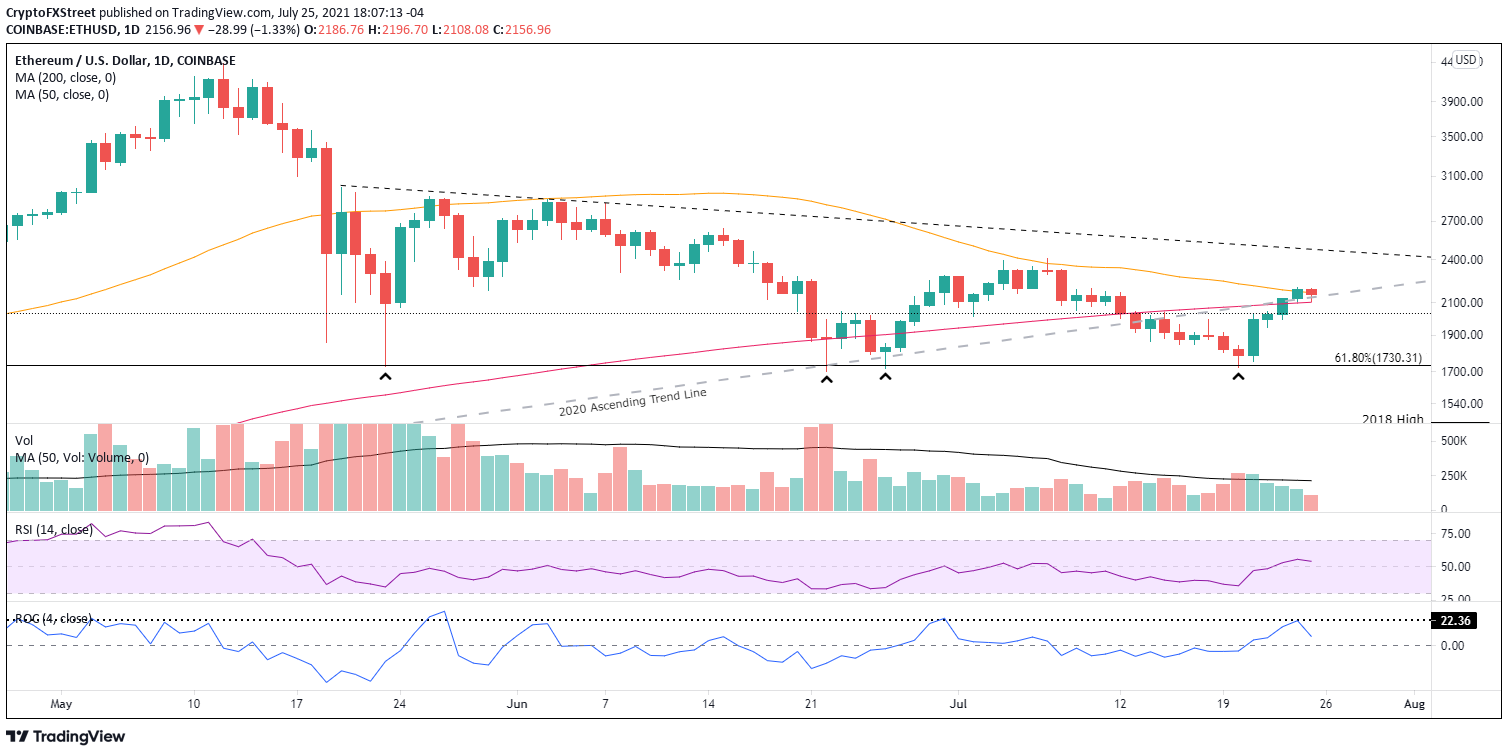
ETH/USD daily chart
If Ethereum price cannot hold the February high of $2,041 on a daily closing basis, it nudges the narrative towards another dead cat bounce and a resumption of the larger correction. A drop below $1,700 on a daily closing basis confirms the breakdown from the governing descending triangle pattern and a failure of the 61.8% retracement of the 2020-2021 advance at $1,730. Downside risk extends to the 2018 high of $1,419 and the 50-week SMA at $1,417.
At the time of writing, Ethereum price will close the week with a bullish engulfing week on the bar charts, suggesting the weak holders have been evacuated and ETH can pursue a bullish narrative. A close today above last week’s high of $2,169 will confirm the engulfing week and leave smart contracts giant with only a -4.8% loss for July. Moreover, it will testify to ETH’s ability to successfully juggle the multiple layers of resistance in a reluctant cryptocurrency market.
Here, FXStreet's analysts evaluate where ETH could be heading next as it looks primed for higher highs.
Author

Sheldon McIntyre, CMT
Independent Analyst
Sheldon has 24 years of investment experience holding various positions in companies based in the United States and Chile. His core competencies include BRIC and G-10 equity markets, swing and position trading and technical analysis.


