Ethereum Price Forecast: ETH awaits 30% rally to $3,800
- Ethereum price continues to recover after over half of its gains have been wiped out from the May market crash.
- ETH appears to be trading within an ascending triangle, setting up a price structure that could indicate a 30% price surge.
- The bullish thesis could only be unraveled if the cryptocurrency is able to sustain above the 50 twelve-hour moving average and manages to break above $2,936.

Ethereum price has continued to make higher lows since its massive crash that sent the cryptocurrency to a swing low of $1,732, wiping out 60% of its gains. Although ETH is still in recovery, the current price structure indicates that Ethereum is ready for a breakout.
Ethereum price primed to breakout
Ethereum price has reclaimed almost 50% of its losses from its deep plunge under $2,000 on May 23. Speculation looms of ETH showing signs of capitulation as the network has seen a spike in exchange inflow.
According to behavioral analytics firm Santiment, it is not uncommon for large inflows of tokens sent to exchanges preceding rapid price growth.
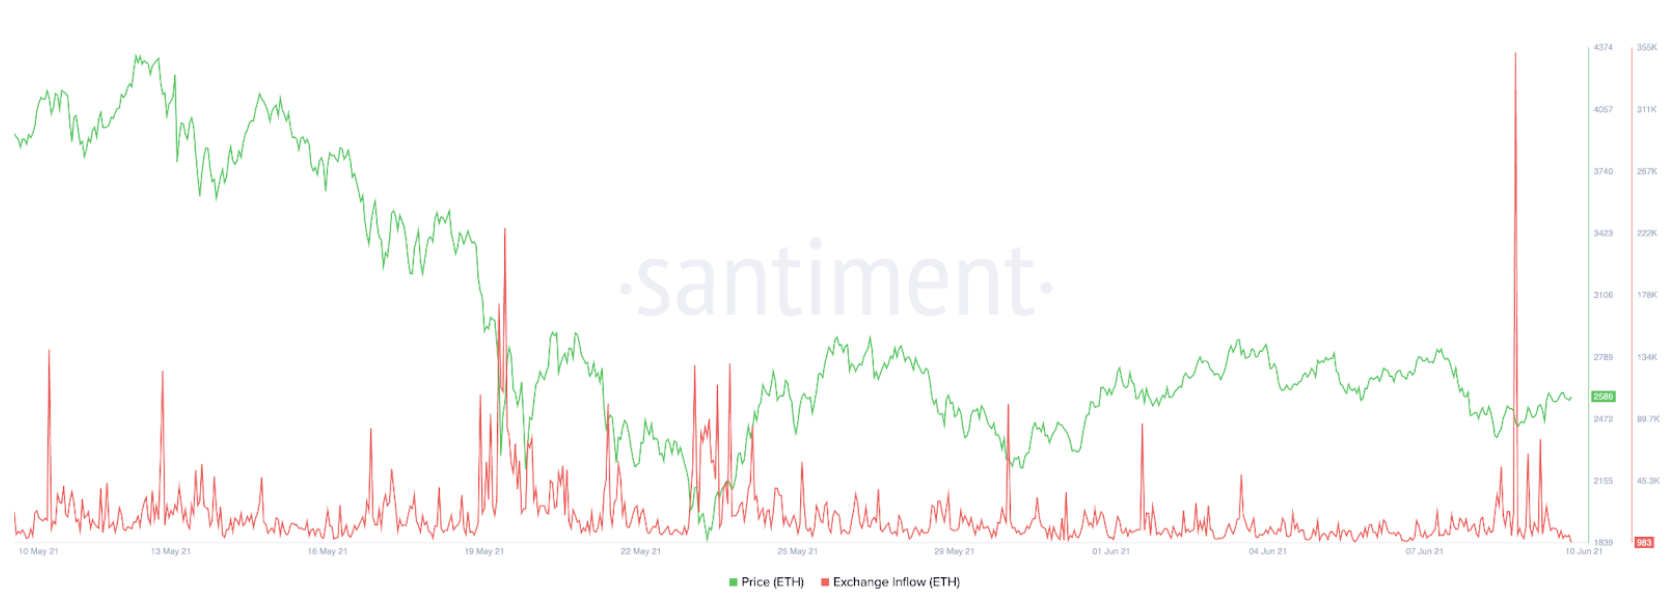
ETH exchange inflow
On the 12-hour chart, ETH appears to be forming an ascending triangle, forming a horizontal trend line drawn along the swing highs, and a rising trend line established by connecting the swing lows.
Ascending triangles are considered to be a bullish formation that usually indicates accumulation. As the pattern develops, the volume contracts until a potential breakout occurs.
The upside target of the pattern is calculated by measuring the widest distance of the pattern and adding it to the horizontal trend line. The measured move of a potential breakout for ETH is 30%, reaching $3,810. This Ethereum price point coincides with the 78.6% Fibonacci extension level, adding credence to the bullish thesis.
The Bollinger Bands squeeze could also indicate that Ethereum is anticipating a large price move.
Now, the 50 twelve-hour moving average acts as critical resistance for ETH, and a break above this level could galvanize investors’ interest, adding fuel for a potential rally. Failure to sustain above this price point could shift Ethereum price action to continue trading sideways.
ETH bulls must also wait for an escape above the horizontal trend line at $2,936, and a spike in volume before a rally to the upside can be confirmed.
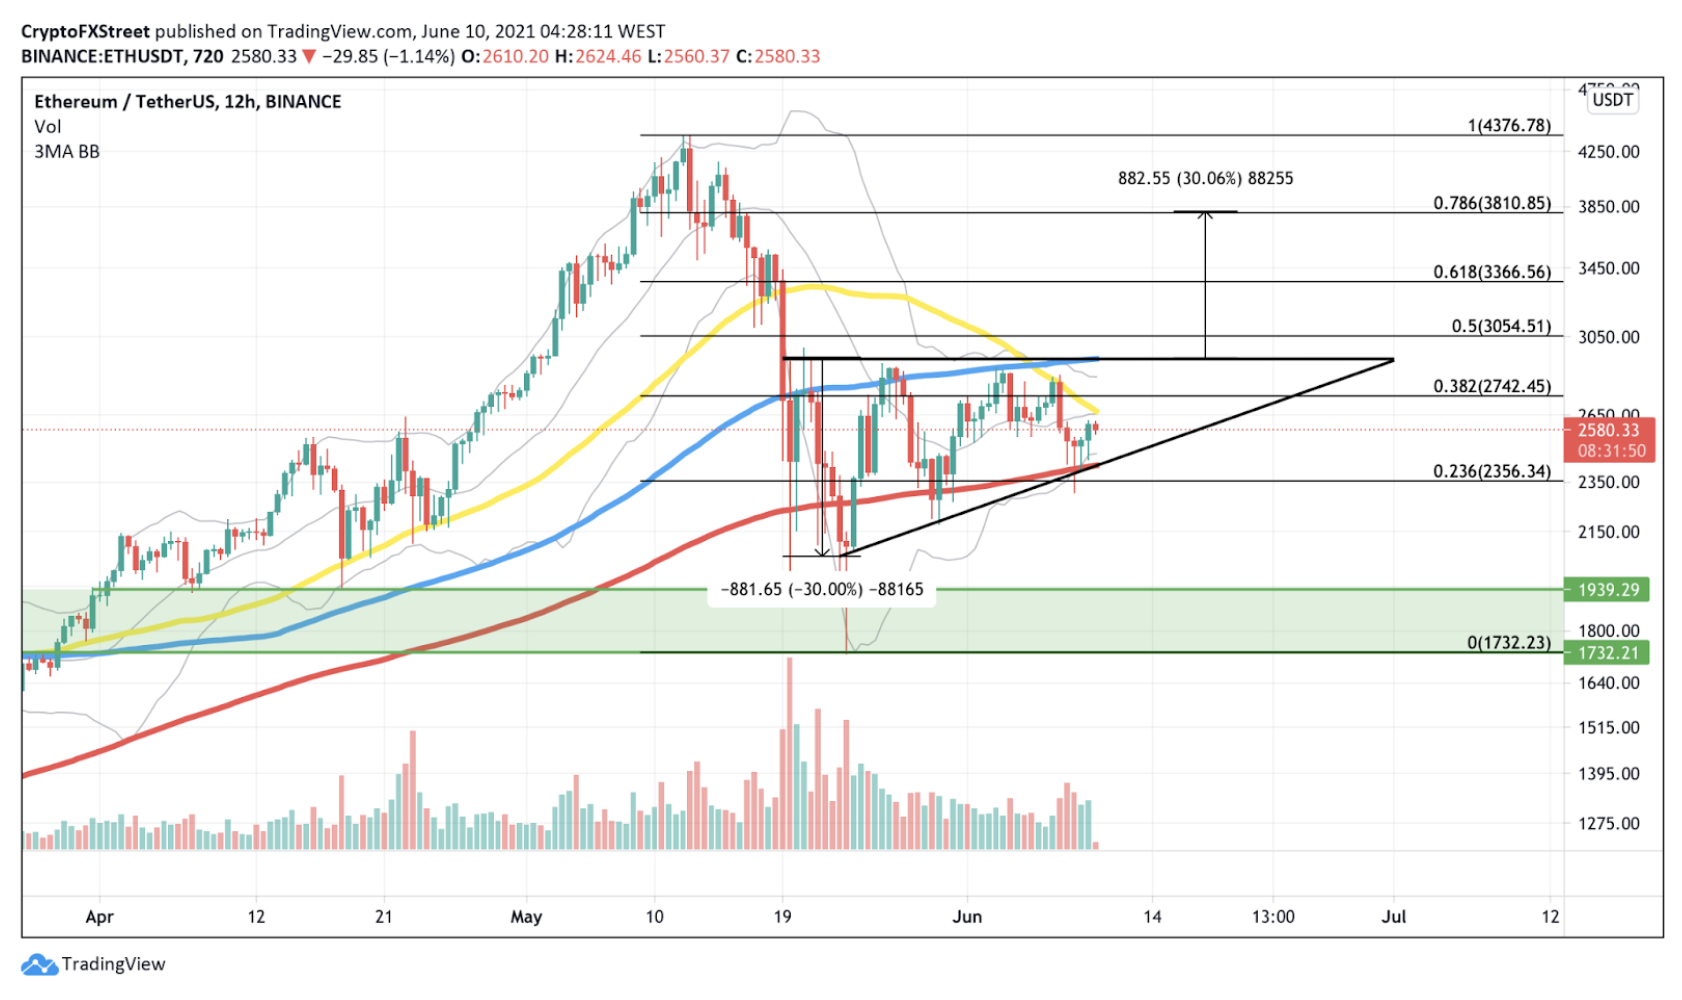
ETH/USDT 12-hour chart
Speculators must take note of the 200 twelve-hour moving average as this level is currently acting as critical support for ETH, as it correlates with the ascending trend line that forms the triangle. A break below this line of defense could see Ethereum free fall to below $2,000 once again, dipping to its demand barrier, ranging from $1,732 to $1,939.
Author

Sarah Tran
Independent Analyst
Sarah has closely followed the growth of blockchain technology and its adoption since 2016.


