- Ethereum price is consolidating inside a symmetrical triangle pattern, suggesting a 36% move.
- Transactional data shows that an upside move is likely due to the lack of resistance levels.
- Technicals hint at a bullish outlook only after a decisive close above $2,000.
The Ethereum price is trading inside a symmetrical triangle formation that has no inherent bias. Hence, a breakout could head either way.
Ethereum price remains undecided
The Ethereum price has been moving sideways for more than a month, creating lower highs and higher lows, leading to a symmetrical triangle pattern.
Although this type of technical pattern doesn’t have a bias for the trend’s direction, it forecasts a 36% price swing.
This target is determined by measuring the distance between the triangle’s pivot high and low, and adding it to the breakout point. A decisive close above $1,878 will signal the start of a new uptrend that could result in a 36% uptick to $2,563. However, if ETH slices through $1,588, it might trigger a 36% fall to $1,000.
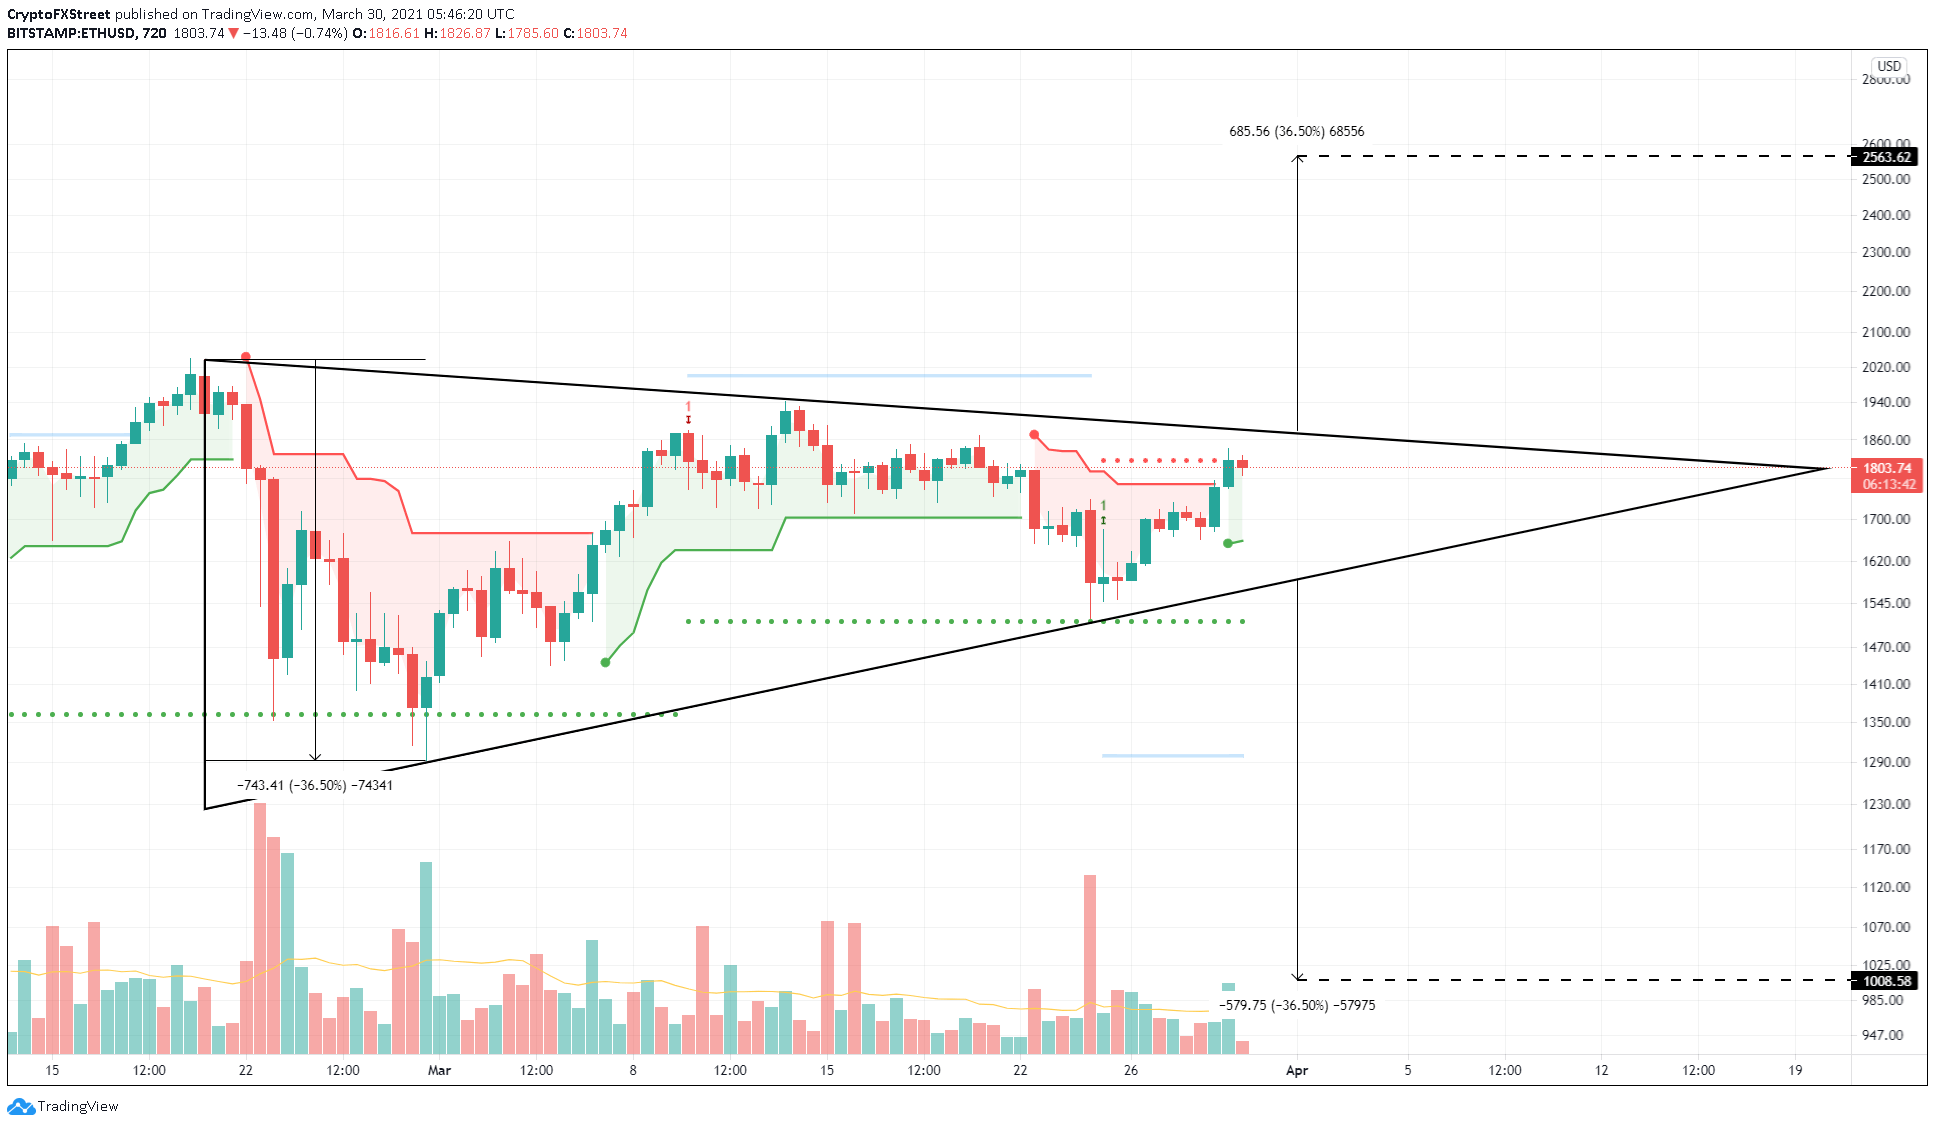
ETH/USD 12-hour chart
Although unclear from a technical point of view, IntoTheBlock’s In/Out of the Money Around Price (IOMAP) model suggests a bullish outlook due to the lack of resistance barriers ahead. Solidifying this is the stable support barriers present immediately below.
IOMAP cohorts reveal 490,000 addresses that purchased 12.05 million ETH are present around $1,723. Any short-term bearish spikes will be absorbed by investors in this area, resulting in a bounce.
Therefore, a decisive close above the setup’s upper trend line will kickstart a 36% bull rally. Regardless, a secondary confirmation will arrive after ETH slices through the Momentum Reversal Indicator’s breakout line at $2,000.
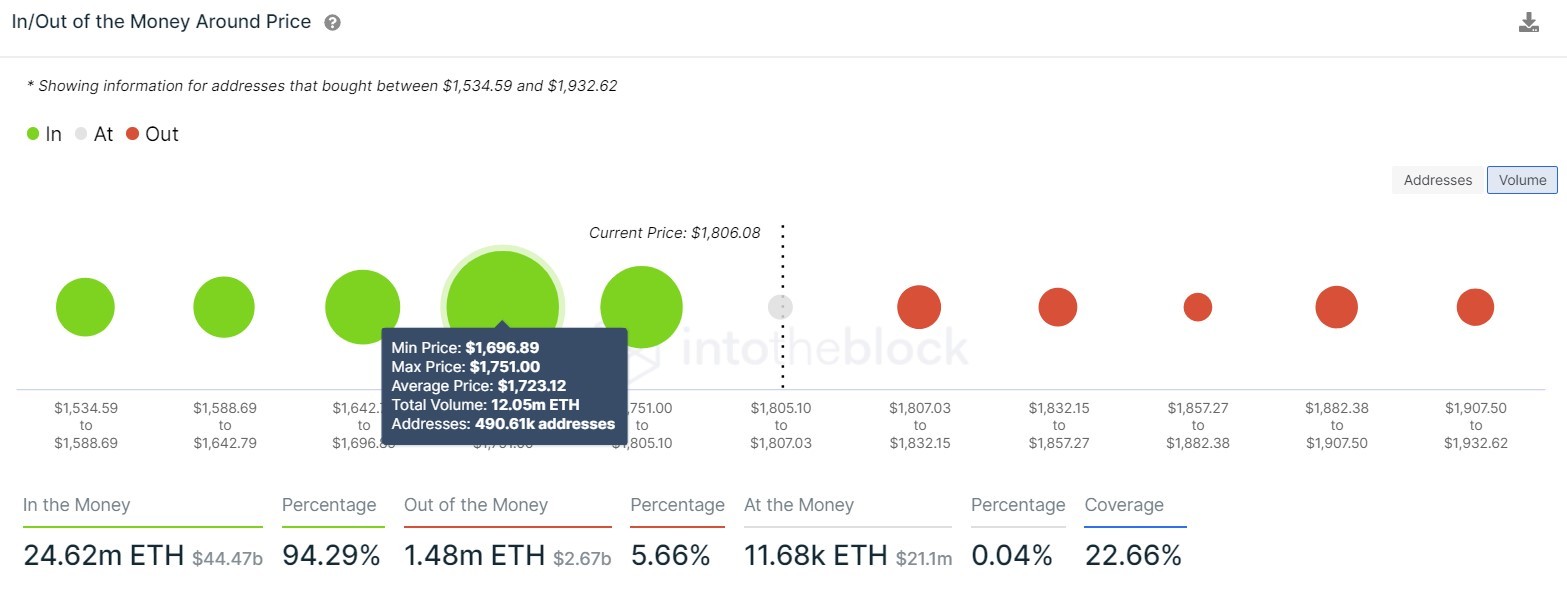
Ethereum IOMAP chart
A failure to surge past the upper trend line or rejection around MRI’s State Trend Resistance at $1,818 could lead to a pullback. If this move breaks below $1,588, it would invalidate the bullish outlook and trigger a bearish one.
In this case, the Ethereum price will first face MRI’s State Trend Support at $1,515. Following a breach of this level, ETH could find support at $1,427, coinciding with the 200 Simple Moving Average (SMA).
MRI’s breakout line at $1,300 will serve as a significant deterrent to the bearish momentum. If ETH for any unforeseen reason pierces this level, the symmetrical triangle’s downward target of $1,000 is likely to be attained.
Information on these pages contains forward-looking statements that involve risks and uncertainties. Markets and instruments profiled on this page are for informational purposes only and should not in any way come across as a recommendation to buy or sell in these assets. You should do your own thorough research before making any investment decisions. FXStreet does not in any way guarantee that this information is free from mistakes, errors, or material misstatements. It also does not guarantee that this information is of a timely nature. Investing in Open Markets involves a great deal of risk, including the loss of all or a portion of your investment, as well as emotional distress. All risks, losses and costs associated with investing, including total loss of principal, are your responsibility. The views and opinions expressed in this article are those of the authors and do not necessarily reflect the official policy or position of FXStreet nor its advertisers. The author will not be held responsible for information that is found at the end of links posted on this page.
If not otherwise explicitly mentioned in the body of the article, at the time of writing, the author has no position in any stock mentioned in this article and no business relationship with any company mentioned. The author has not received compensation for writing this article, other than from FXStreet.
FXStreet and the author do not provide personalized recommendations. The author makes no representations as to the accuracy, completeness, or suitability of this information. FXStreet and the author will not be liable for any errors, omissions or any losses, injuries or damages arising from this information and its display or use. Errors and omissions excepted.
The author and FXStreet are not registered investment advisors and nothing in this article is intended to be investment advice.
Recommended Content
Editors’ Picks

XRP eyes recovery but derivatives market stalls progress
Ripple's XRP is up 2% in the early Asian session on Thursday following rising accumulation among investors and a potential bottom signal in the MVRV Ratio.

Ethereum could see a boost as Cboe files for 21Shares to begin staking within its ETH ETF
Ethereum (ETH) could be set for increased demand in the coming months following Cboe BZX 19b-4 filing with the Securities & Exchange Commission (SEC) to enable staking for the 21Shares Core Ethereum exchange-traded fund (ETF).

Bitcoin and crypto recovers from CPI data as Trump pushes Russia–Ukraine diplomacy
Bitcoin (BTC) and the crypto market saw slight gains on Wednesday after President Donald Trump's resolution calls with Russian President Vladimir Putin and Ukraine's President Volodymyr Zelenskyy.

Ethereum Price Forecast: ETH eyes $3,000 as Trump and Putin agrees to begin negotiations on ending Ukraine war
Ethereum (ETH) saw a 3% gain on Wednesday following United States (US) President Donald Trump's agreement with Russian President Vladimir Putin to begin negotiations to end the Russian-Ukraine war.

Bitcoin: BTC shows weakness, bears aiming for $90,000 mark
Bitcoin price hovers around $97,000 on Friday after losing nearly 5% in the last three days. CryptoQuant weekly report shows that activity on the Bitcoin network has declined to its lowest level in a year.

The Best Brokers of the Year
SPONSORED Explore top-quality choices worldwide and locally. Compare key features like spreads, leverage, and platforms. Find the right broker for your needs, whether trading CFDs, Forex pairs like EUR/USD, or commodities like Gold.