Ethereum Price Prediction: ETH struggles to establish clear trend
- Ethereum price is nearing the lower trend line of a massive ascending parallel channel.
- Although a bounce seems likely and logical, ETH might not witness this move due to stacked resistance barriers ahead.
- A breakdown of the support level at $1,513 will indicate the start of a downtrend.

Ethereum price is treading dangerously close to the lower boundary of a technical formation. A breakout from this level could spell disaster for ETH.
Ethereum price at make-or-break point
Ethereum price has traded within the confines of an ascending parallel channel for over two months. Within this period, ETH created two higher highs and four higher lows.
Although a breakout from the lower trend line of the setup is bearish, ETH bulls seem to have defended the latest retest. Now, a bounce seems likely for the smart contracts platform token.
If the bull rally continues, Ethereum price could see a 55% upswing toward the 127.2% Fibonacci extension level at $2,500. However, this upswing will be anything but manageable due to the multitude of supply barriers present between the current price and the target.
To confirm a solid bullish momentum, a decisive close above $1,744 coinciding with the 78.6% Fibonacci retracement level and the Momentum Reversal Indicator’s State Trend Resistance at $1,818 is necessary.
A successful and sustained climb above these levels suggests that Ethereum price is ready for the next leg up.
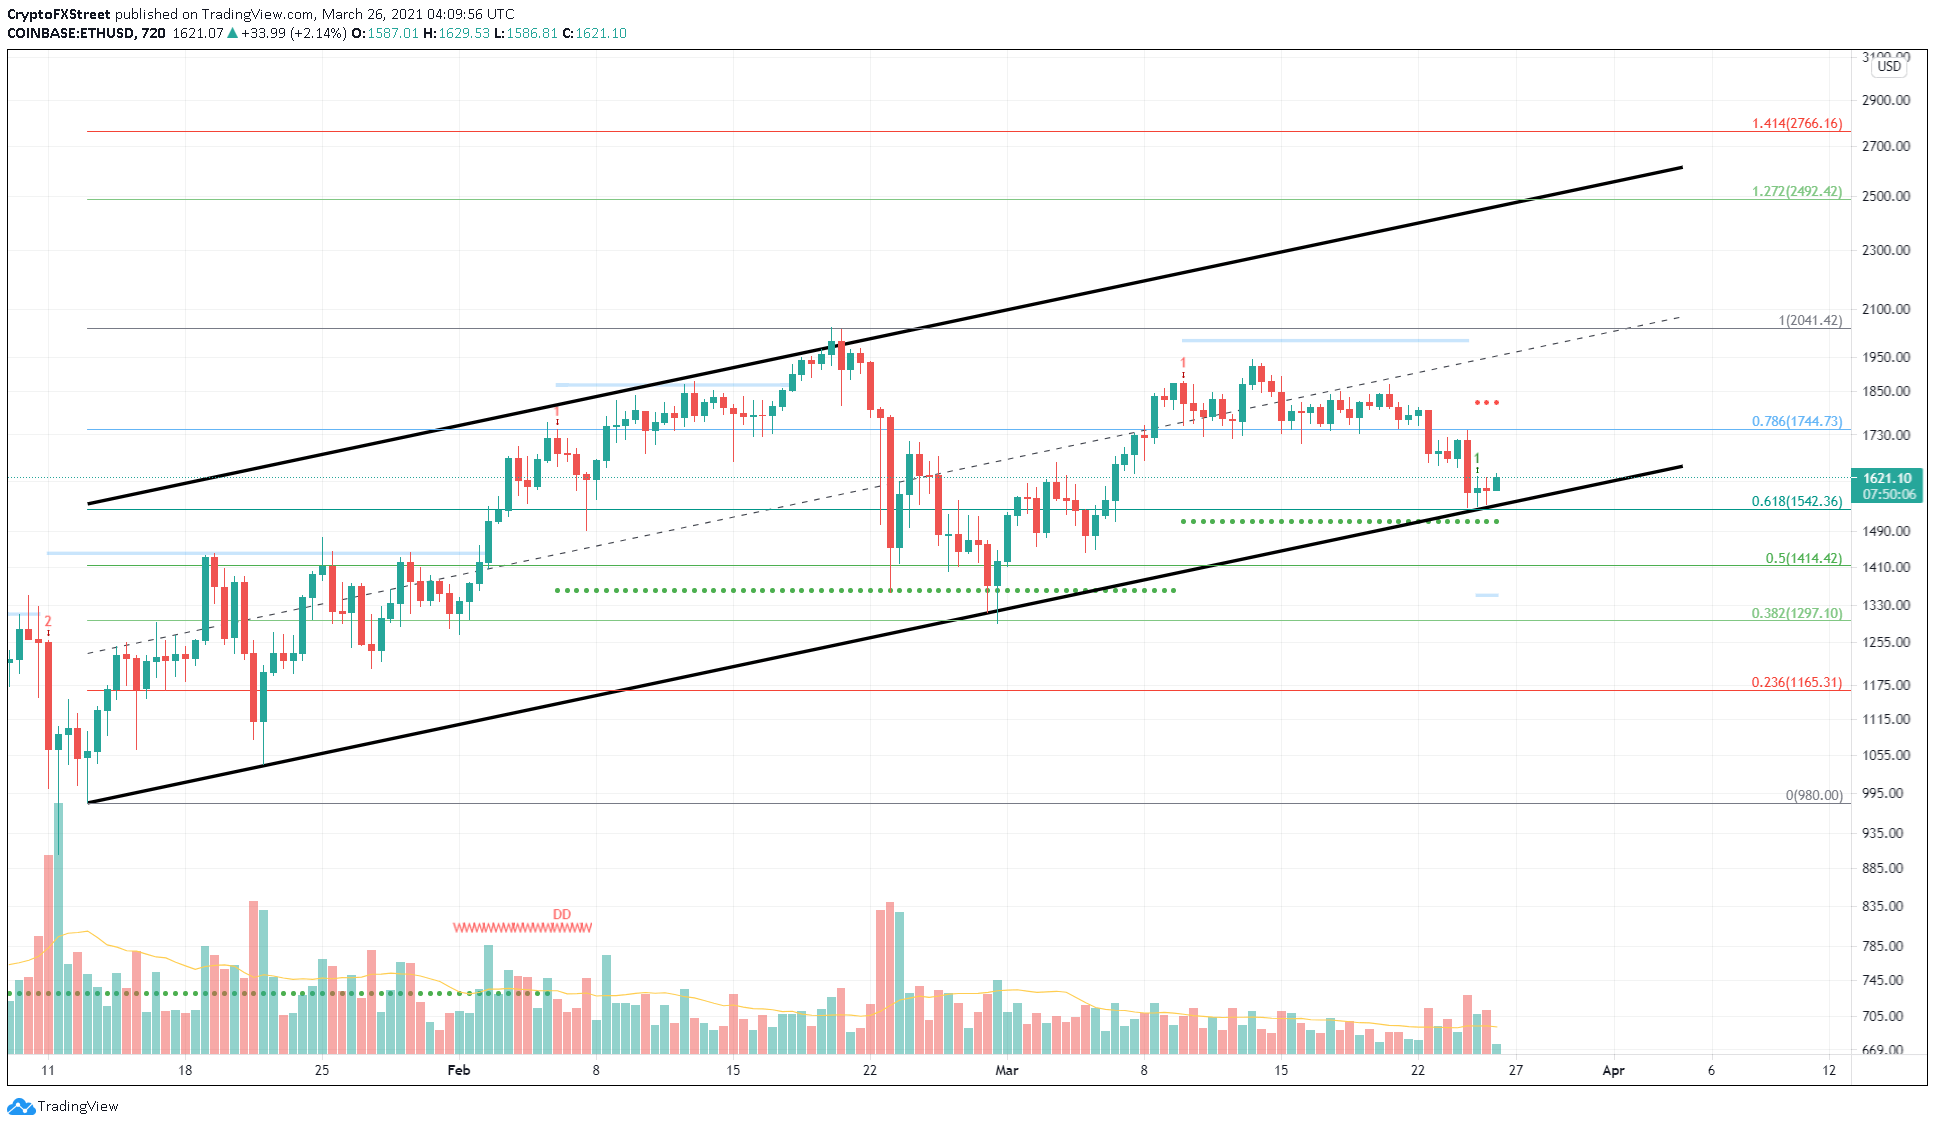
ETH/USD 12-hour chart
Adding credibility to this upswing is the stark decrease in the number of daily active deposits. A 21% decrease in this metric suggests that investors are done booking profits, at least for now. Hence, this a bullish development for Ethereum price.
Meanwhile, the number of daily active addresses has not seen a massive change. Despite the recent 20% crash, the number of users interacting with the ETH blockchain remains the same, which can be viewed as a bullish sign.
%20[08.21.23,%2026%20Mar,%202021]-637523294312632255.png)
Ethereum Daily Active Addresses and Daily Active Deposit chart
Regardless of the bullish outlook, IntoTheBlock’s In/Out of the Money Around Price (IOMAP) model paints a rather bearish picture for Ethereum price.
The resistance levels are stacked on top of each other, from $1,640 to $1,784. In fact, 1.2 million addresses that previously purchased $13.25 million ETH are “Out of the Money.” Therefore, ETH price needs to break past the initial set of resistance zones and then face a cluster of underwater investors to have any chances of surging higher.
Failing to do so will add to the already grim scenario and kickstart a descent.
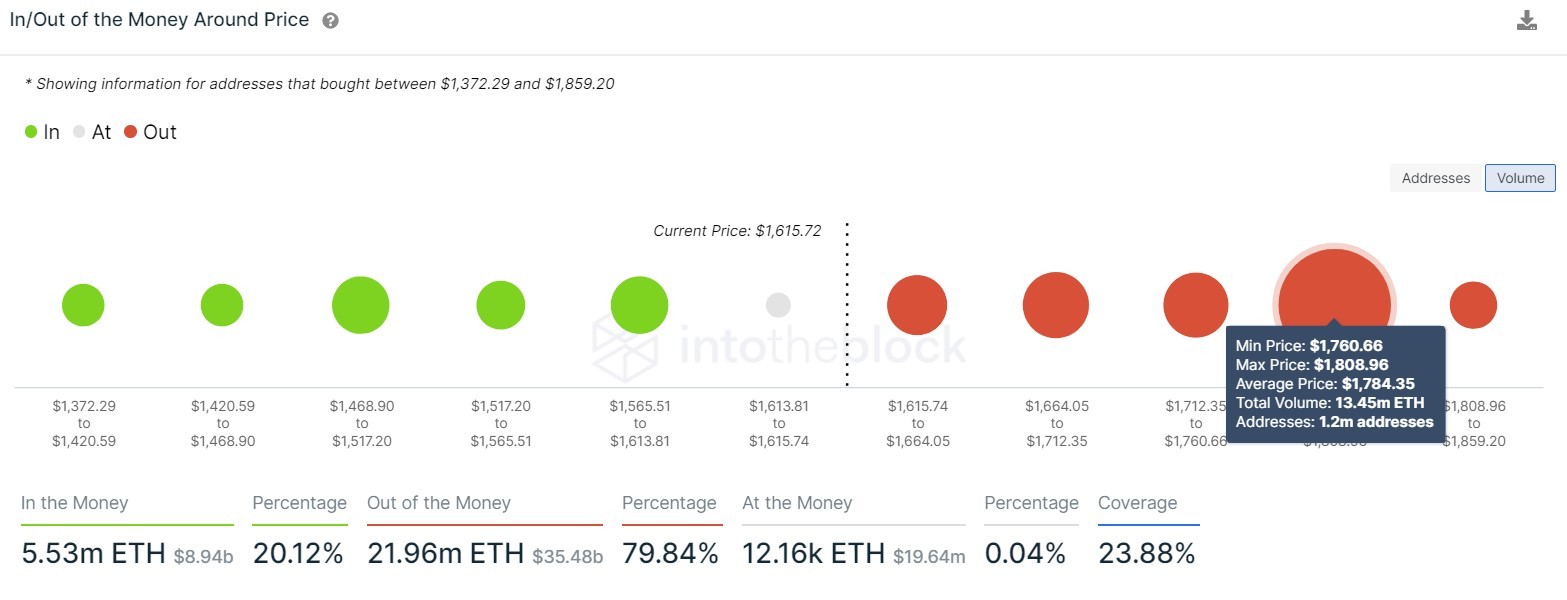
Ethereum IOMAP chart
To conclude, the Ethereum price seems to be facing Insurmountable odds and could slide 10% lower to $1,360 if the crucial support level at $1,510 is breached.
Author

Akash Girimath
FXStreet
Akash Girimath is a Mechanical Engineer interested in the chaos of the financial markets. Trying to make sense of this convoluted yet fascinating space, he switched his engineering job to become a crypto reporter and analyst.


![Hyperliquid representatives, Trade[XYZ] meet SEC Crypto Task Force to discuss digital asset regulation](https://editorial.fxsstatic.com/images/i/Hyperliquid_Bull.png)
