Ethereum Price Analysis: ETH weekly performance doesn’t match the media hysteria
- Ethereum price continuing constructive consolidation above previous all-time high.
- Options expiration generated upside volatility.
- 10-week simple moving average (SMA) acting as critical support on a closing basis.

Ethereum price is about to close today, down only 5.8% for the week, a minor blip in the overall picture and certainly far removed from the graphic headlines describing ETH price action earlier this week. From a longer-term perspective, the trend remains higher, but the correction process does need more time to release the extreme overbought condition that accompanied the race into new highs.
Ethereum price consolidation could take time
A cryptocurrency that advances almost 2200% in one year with only one 50% correction is vulnerable to a deep and drawn-out correction. ETH is now in the early stages of that process, and keep in mind that corrections are not only in price but also in time. So there is every reason to expect that this consolidation will test the patience of the bulls.
The current correction signals were prominent, particularly in rapid decline in trading volume once ETH broke out to all-time highs. For the week beginning January 4 this year, ETH closed with volume of 5.33M, and by the time of the ultimate high during the week of February 15, volume was just 1.83M, representing a 65% decline. Attempting to conquer the psychologically important $2,000 level combined with the looming 1.618 Fibonacci extension at $2,247 would not happen on average volume.
Moving forward, ETH will likely consolidate for several more weeks (ideally) with support coming from the 10-week SMA at $1,652.90, the January 2018 high at $1,419.96, and then the 0.382 Fibonacci retracement level of the 2020-2021 rally at $1,296.
A price push above $1,944 could signal that the correction process is over, but it will probably be another fake-out to the upside. Of course, a weekly close above $2,000 will negate the working thesis of a prolonged correction.
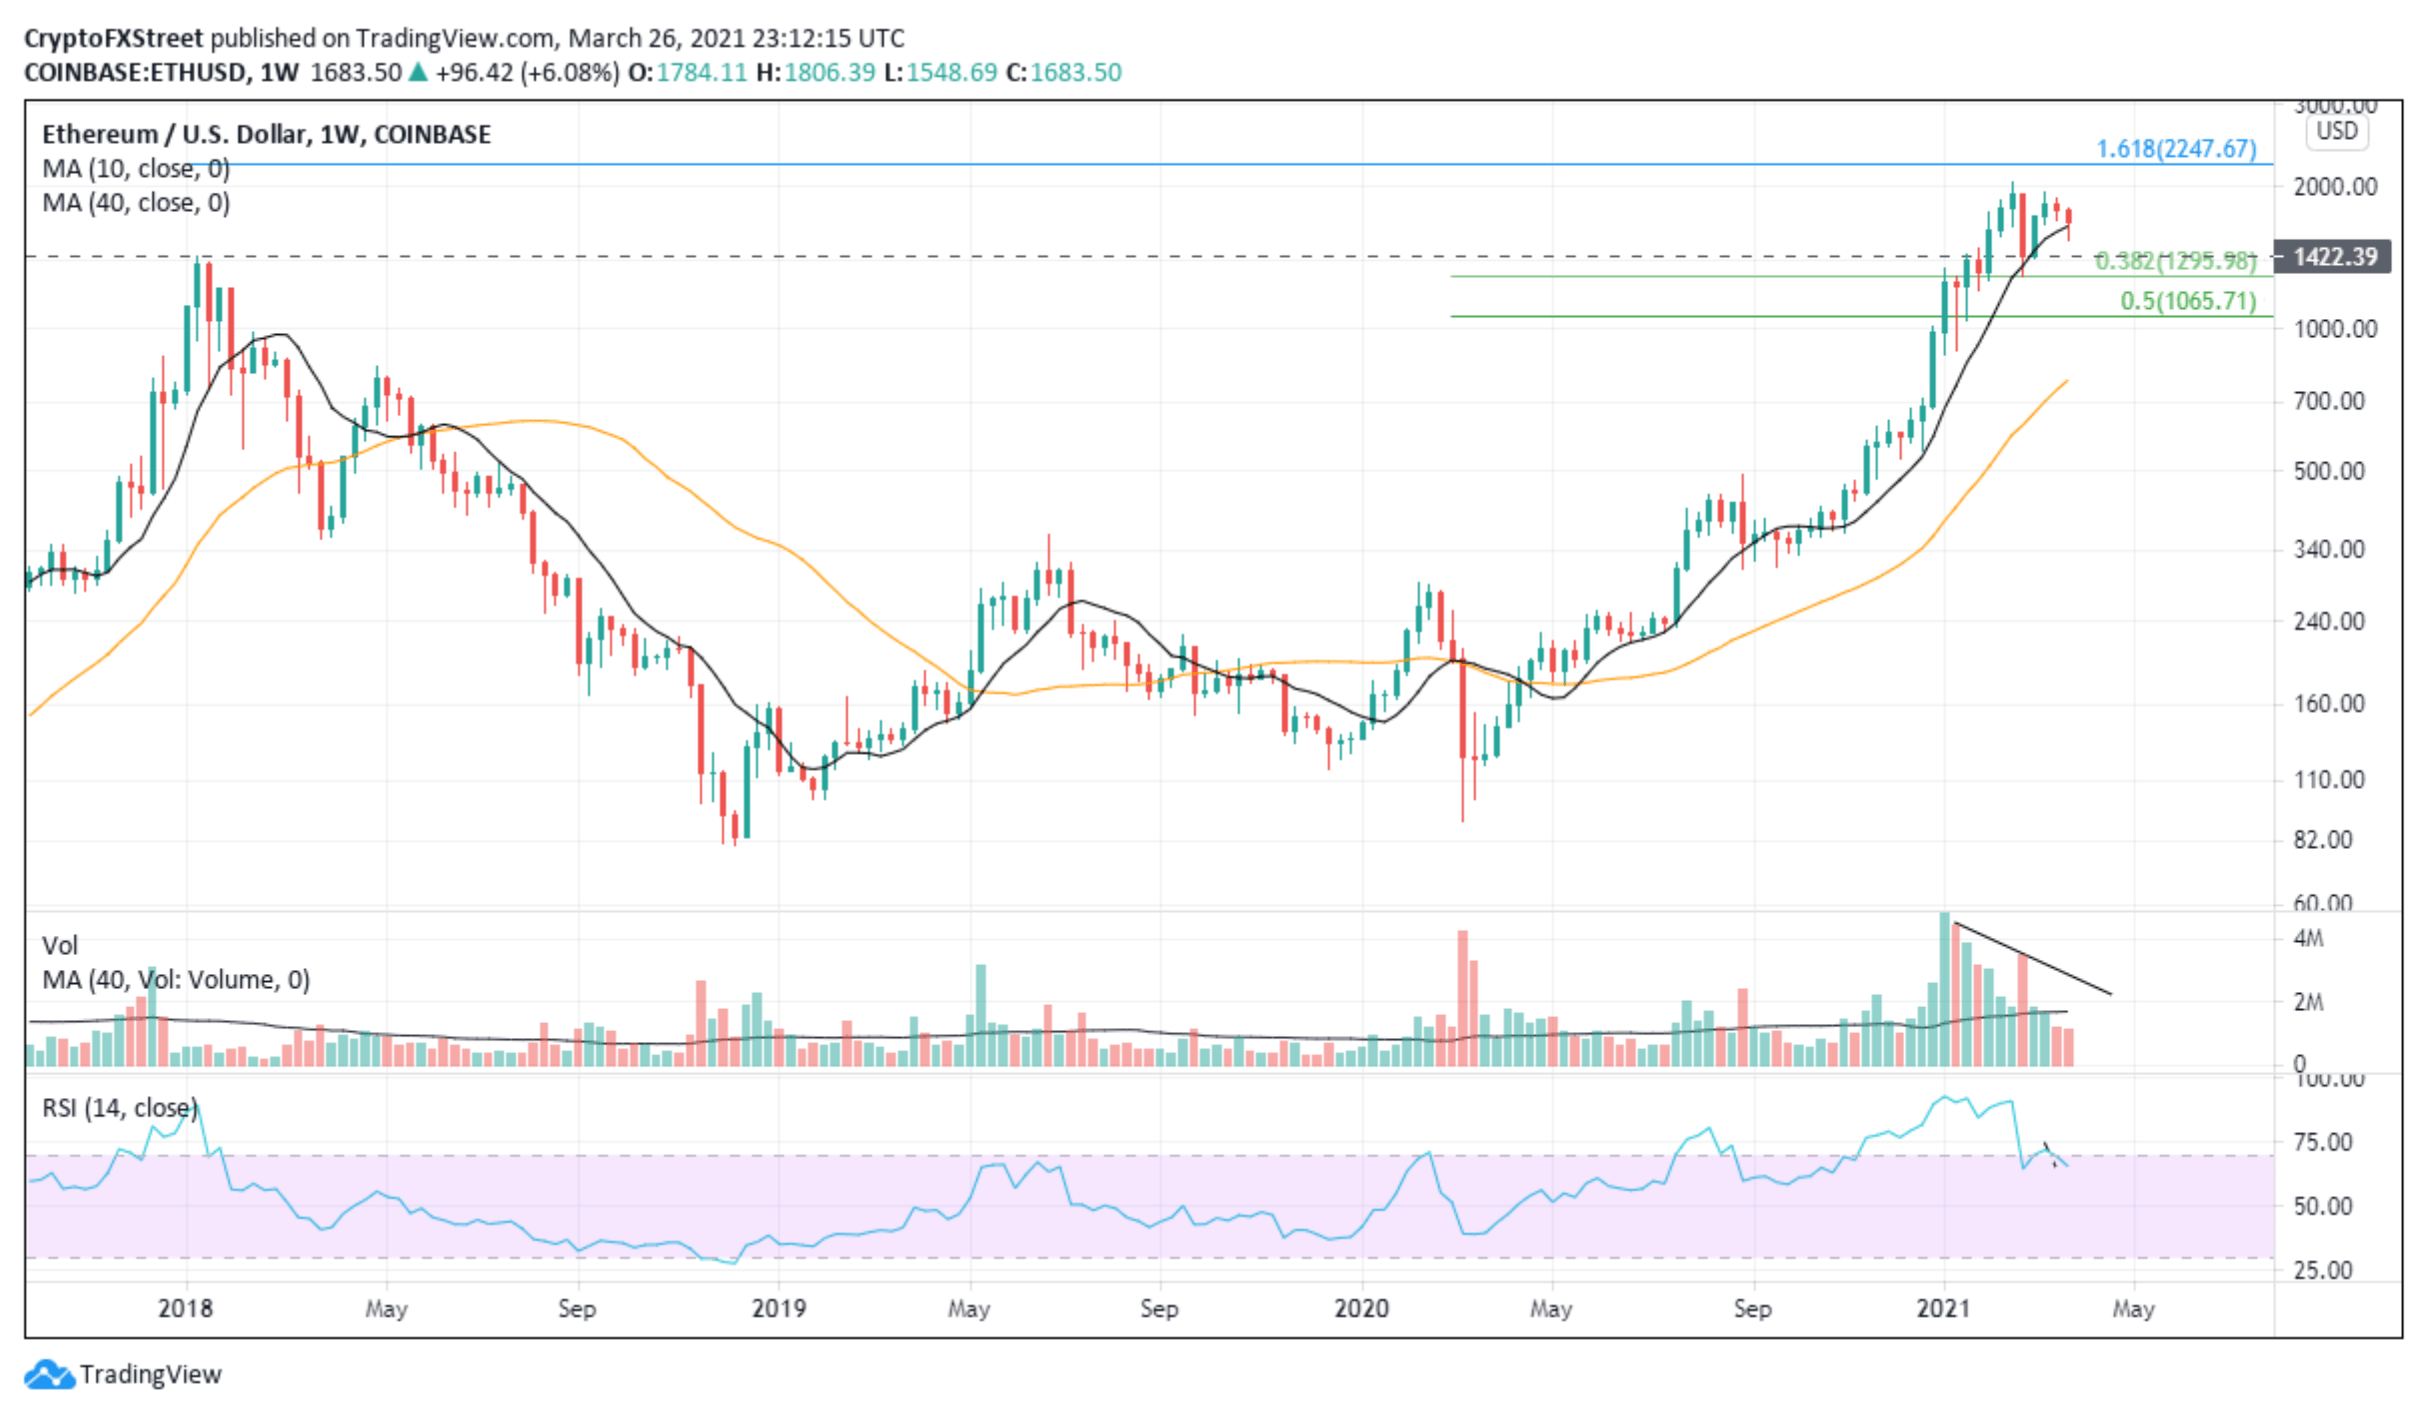
ETH/USD weekly chart
On the downside, a weekly close below the February 28 low at $1,292.76 would reset the working thesis and open up the possibility that a test of the 0.50 retracement level is on the horizon.
Author

Sheldon McIntyre, CMT
Independent Analyst
Sheldon has 24 years of investment experience holding various positions in companies based in the United States and Chile. His core competencies include BRIC and G-10 equity markets, swing and position trading and technical analysis.


