Ethereum Price Forecast: ETH smart money plans to liquidate these traders
- Ethereum price has created pockets of buy-side liquidity as it has declined since February 16.
- The inefficiencies present at roughly $1,700 and $1,500 will play an important role in where ETH will go next.
- A four-hour candlestick close above $1,677 with a decisive flip of this monthly hurdle into a support floor will invalidate the bearish thesis.

Ethereum price shows a steady downtrend since February 16. While this descent was exacerbated on February 24, the recovery rally over the weekend seems to have come to the rescue. Currently, ETH hovers without a directional bias as it decides between inefficiencies and liquidity pool raids present at both the top and bottom.
Also read: Everything you need to know about Ethereum’s Shanghai hard fork and why it matters
Ethereum price and liquidity raids
Ethereum price set up a string of lower highs with long wicks since producing a local top at $1,742 on February 16. Resting above these wicks are buy-side liquidity or buy-stops of investors that opened ETH short positions. The same can be seen marked on the chart as liquidity.
These short positions are definitely in-the-money since Ethereum price slid 10% from its aforementioned local top and set up a local low at $1,557. During this descent, Ether produced an inefficiency between $1,686 and $1,695, termed a Fair Value Gap (FVG).
As Ethereum price hovers around $1,640, one of two things is going to happen - a clockwork-like retracement that will produce the fourth consecutive swing low for ETH or an upthrust that propels the Ether to tag the $1,677 monthly resistance level.
Considering the ongoing downtrend, the former scenario seems more likely to play out. In such a case, Ethereum price is primed to tag the immediate FVG, extending from $1,614 to $1,622. In a highly bearish-case scenario, ETH could retest the $1,519 to $1,534 FVG, coinciding with the 79% retracement level at $1,520.
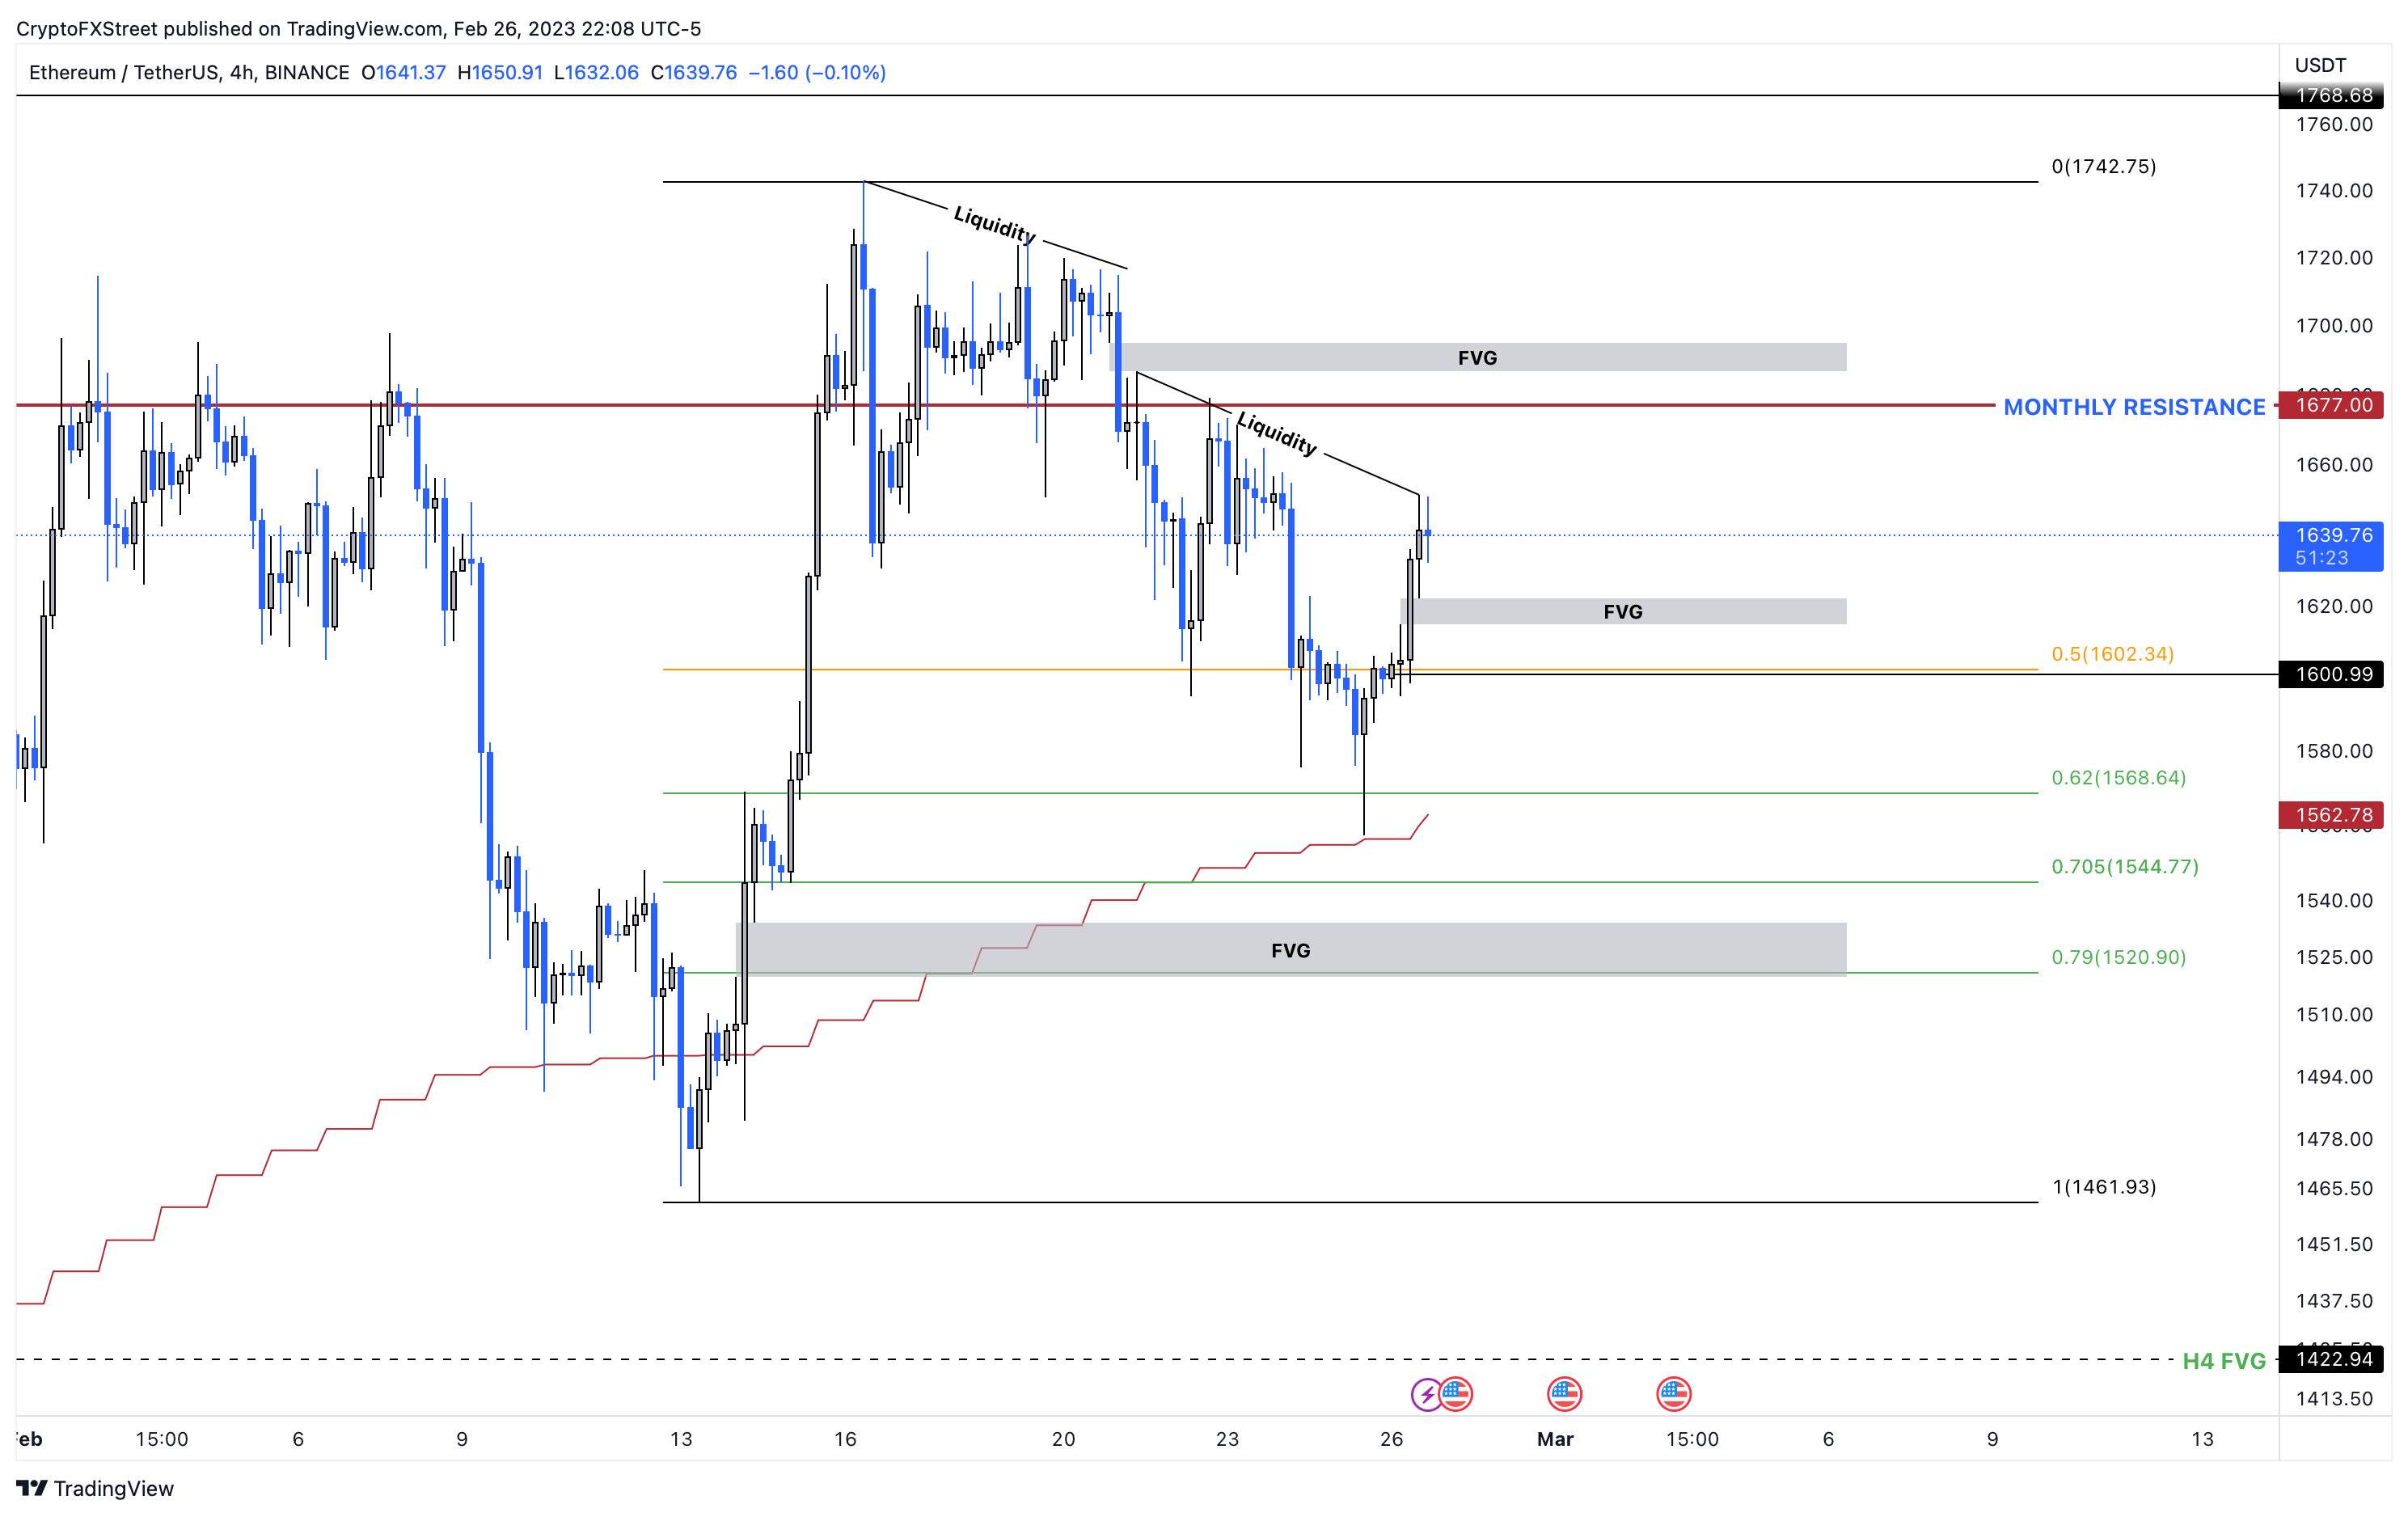
ETH/USDT 4-hour chart
While the bearish outlook described above is based on the clockwork price action of Ethereum, investors need to be cautious about a sudden spike in buying pressure. A four-hour candlestick close above $1,677, with a decisive flip of this monthly hurdle into a support floor, will invalidate the bearish thesis for ETH.
Such a move could further propel Ethereum price to collect liquidity up to $1,742 and potentially push up to $1,800.
Author

Akash Girimath
FXStreet
Akash Girimath is a Mechanical Engineer interested in the chaos of the financial markets. Trying to make sense of this convoluted yet fascinating space, he switched his engineering job to become a crypto reporter and analyst.


