Ethereum Price Forecast: ETH on-chain metrics drag on performance
- Ethereum price is beginning to define a new trading range between the 61.8% Fibonacci retracement and February high.
- 200-day simple moving average (SMA) also providing temporary support and resistance during the fluctuations.
- Daily Active Addresses (DAA) metric continues a descent, pointing to growing abstinence among ETH holders.

Ethereum price shows no conviction or commitment as it rebounds again from the increasingly important 61.8% Fibonacci retracement level of the March 2020-May 2021 advance. Without accumulation and impulsiveness, ETH will be challenged to bury the resistance accompanying the 200-day SMA and the February high. Overall, the smart contracts giant has done little to reveal the more significant directional intentions.
Ethereum price continues to undermine investors conviction
The positive response of Ethereum price to the outstanding support framed by the 200-day SMA at $1,878, the 2020 rising trend line at $1,793, the 61.8% retracement of the March 2020-May 2021 advance at $1,730 and the May 23 low of $1,728 created a hint of optimism for enthusiastic ETH investors and short term speculators on June 22.
However, Ethereum price action since June 22 has not been compelling or comparable to some of the rebounds in other altcoins, suggesting ETH is grappling with depleted interest even on a day-to-day basis. It makes attempts to overcome the February high at $2,041 on a daily closing basis a remote possibility. Confounding the outlook is a volume profile that only speaks to distribution, not accumulation.
A daily close above the February high of $2,041 is the first step to getting ETH standing on both feet, but Ethereum price will still be tasked with the heavy resistance of the 50% retracement of the advance from the March 2020 low to May 2021 high at $2,237.
Additional upside targets for Ethereum price include the 50-day SMA at $2,675, the apex of the symmetrical triangle at $2,730 and the Ichimoku Cloud, creating a trifecta of resistance.
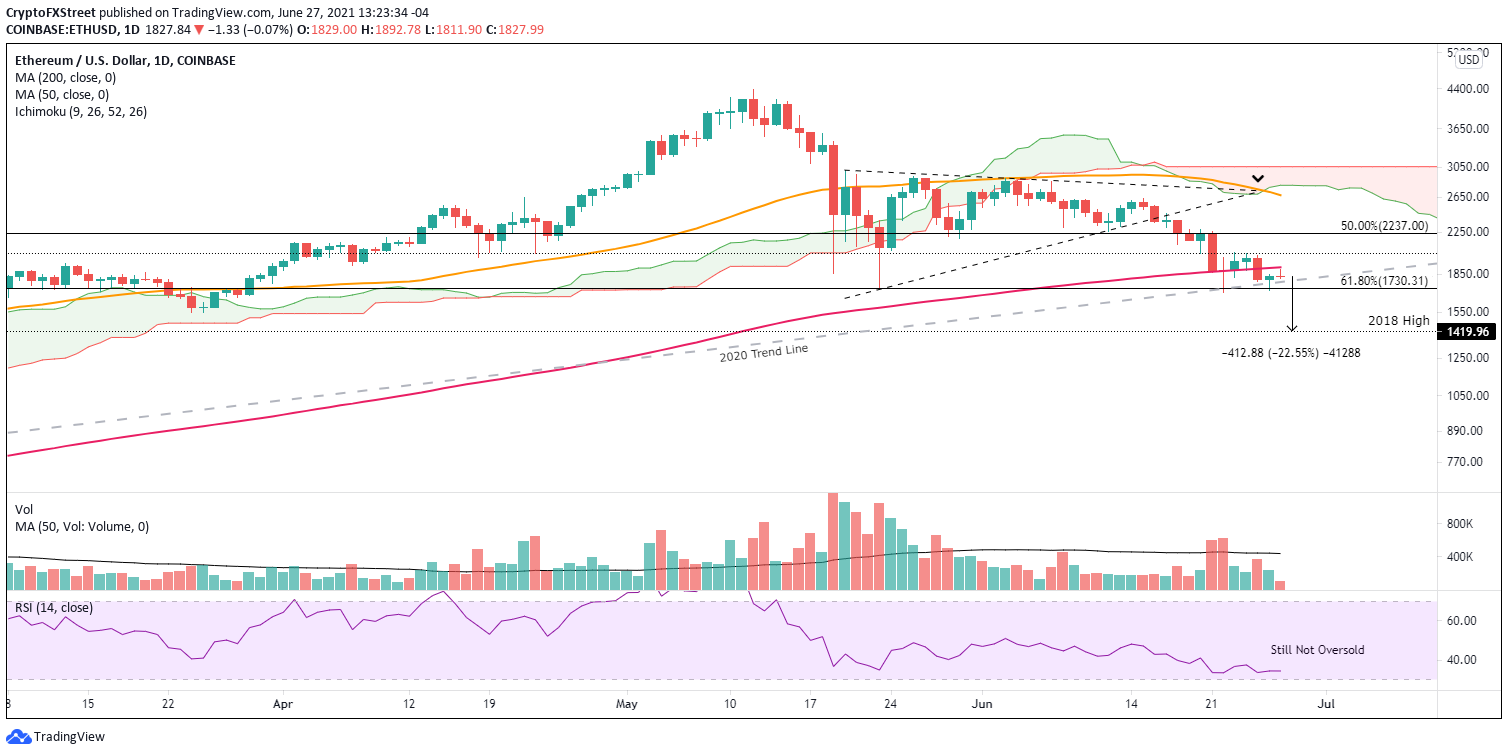
ETH/USD daily chart
If Ethereum price logs a daily close below the 2020 trend line at $1,782 and the 61.8% retracement at $1,730, ETH may explore the support established by the 2018 high at $1,419, yielding a 22% decline from the current price.
The weak comeback by Ethereum price keeps the heat on the short-term holders of ETH. Based on the Santiment Daily Active Addresses (DAA) data, it appears that interest in the ETH network continues to dwindle. In fact, DAA has fallen 55% from the May high, pointing to a growing avoidance among ETH holders from day-to-day network activity. Moreover, the 30-period average is also tagging lower readings, showing no pause in the abstinence.
Overall, it translates to less value being transmitted on the ETH network and fewer new users entering the cryptocurrency, both of which could pose an obstacle for Ethereum price as it confronts strong resistance.
The downtrend is, of course, not endemic to ETH. Since the market crash, most top cryptocurrencies have shown clear signs of regression in daily address activity.
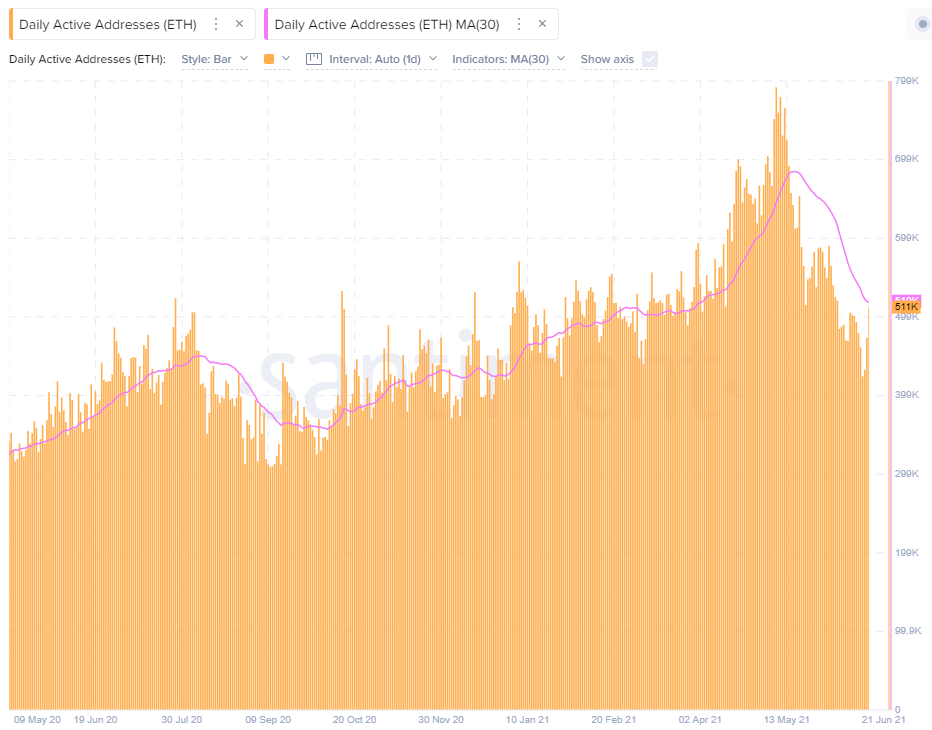
ETH Daily Active Addresses (DAA) - Santiment
Another metric that may signal further Ethereum price weakness is Ethereum’s 365-day MVRV ratio of 5.64%. It is at the lowest reading since May 2020, but it has not reached a negative reading. It suggests that the average gain of all addresses that have acquired ETH in the previous year stands at 5.64%
Generally, the higher the MVRV ratio, the greater the unclaimed profits, thus the higher risk that ETH holders will begin to sell and lower their exposure. This why it is believed that extremely high MVRV ratios indicate overvalued conditions, while very low MVRV ratios may offer a timely opportunity to accumulate.
While the ETH MVRV ratio is a low positive number, it still suggests there could be more selling, pushing the ratio into a negative reading and an undervalued condition. It does not have to reach the levels printed in March 2020 or December 2019 to offer a compelling opportunity, but no doubt, there is room for Ethereum price to decline moving forward.
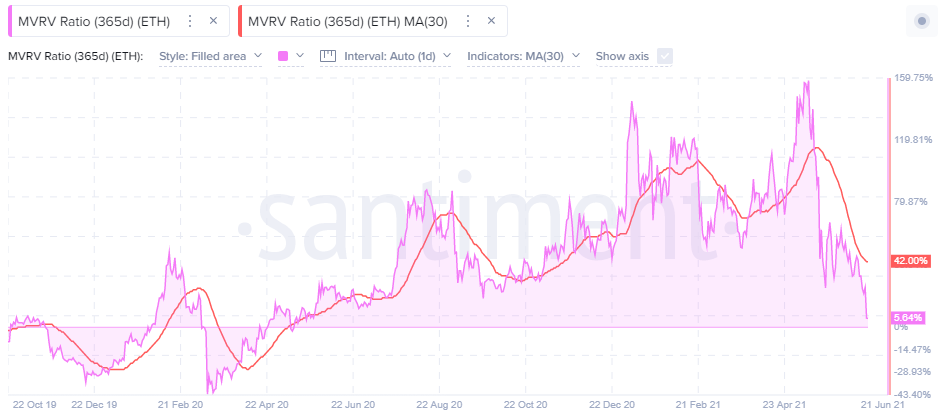
ETH 365-day MVRV Ratio - Santiment
As for the on-chain metrics, it is advisable to monitor Ethereum’s daily active addresses. A continual decline reveals a lack of fundamental support and gloom in ETH holders, challenging a sustainable recovery.
The technical footprint on the charts also shows a discouraged ETH holder as Ethereum price languishes between two crucial price levels. Until there is a meaningful bounce, ETH is dead money.
Author

Sheldon McIntyre, CMT
Independent Analyst
Sheldon has 24 years of investment experience holding various positions in companies based in the United States and Chile. His core competencies include BRIC and G-10 equity markets, swing and position trading and technical analysis.


