Ethereum Price Forecast: ETH bullish impulse holds steady
- Ethereum appears to have secured higher support following the rejection from weekly highs above $1,800.
- An improving network growth and weakening barriers suggest that Ether is likely to breakout.
- The MACD indicator recently flipped bearish, suggesting that sellers are in control.

Ethereum has been searching for higher support in the wake of the rejection suffered this week around $1,880. The overhead pressure appears to be coming down as bulls build upon the immediate anchor at $1,700. Besides, on-chain metrics show that Ether is strong enough to nurture an uptrend targeting new all-time highs above $2,000.
Ethereum's uptrend backed by a stronger on-chain front
Santiment's on-chain data illustrates a recovering Ethereum network growth. The model tracks the number of new addresses joining the network daily. Over the last 30 days, the unique addresses bottomed out at nearly 117,000 on February 15 but have risen to roughly 157,000. The 25.5% growth shows that Ethereum is gaining traction in mainstream adoption and is a positive signal for the price.
%20[09.57.30,%2013%20Mar,%202021]-637512166547822565.png)
Ethereum network growth
The IOMAP model by IntoTheBlock highlights reveals that Ether is sitting on top of a robust support zone. This support runs from $1,664 to $1,716 and represents nearly 496,000 addresses that had previously bought approximately 9.6 million ETH.
On the upside, Etheruem is facing a subtle resistance between $1,770 and $1,801. Here, around 516,000 addresses had previously purchased approximately 3.4 million ETH. The weak resistance implies that the uptrend may be sustained toward $2,000.
-637512166443635237.png)
Ethereum IOMAP model
Meanwhile, the 4-hour chart shows that the smart contract giant token embraced support above the 50 Simple Moving Average (SMA) and the 100 SMA. Bulls are currently tacking the IOMAP resistance at $1,770. If they slice through, Ethereum will rally above $1,800 and perhaps restart the journey to $2,000.
The same chart paints a golden cross pattern following the 50 SMA cross above the 100 SMA. This pattern suggests to traders that the asset's momentum is relatively upward and could be a good time to take a long position.
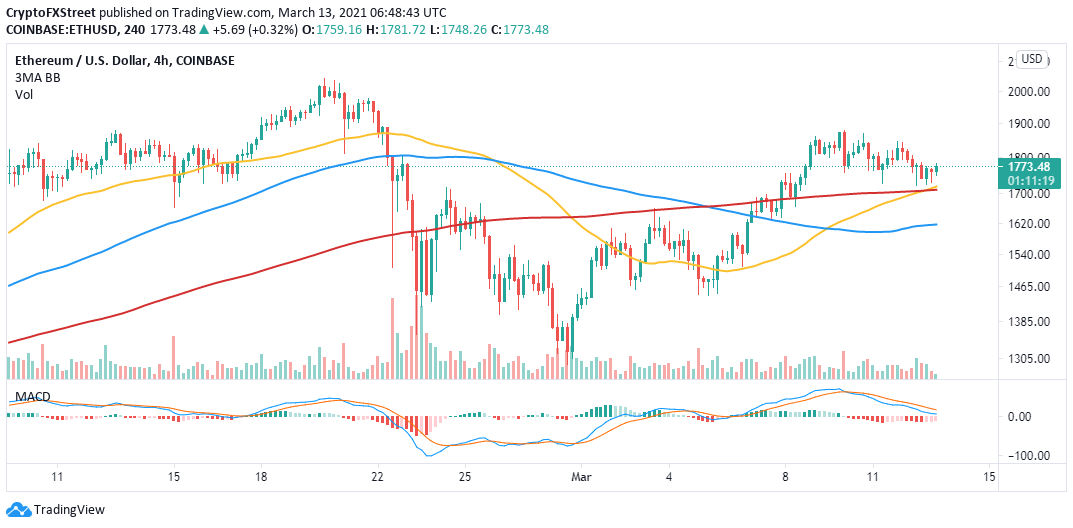
ETH/USD 4-hour chart
Looking at the other side of the picture
The Moving Average Convergence Divergence (MACD) has a bearish impulse, staining a rather bullish technical picture. The sell signal after Ethereum hit a barrier at $1,880. Moreover, the MACD cross under the signal line shows that Ethereum is not out of the woods yet. If the MACD stays in the same position, the downtrend could gain momentum.
Author

John Isige
FXStreet
John Isige is a seasoned cryptocurrency journalist and markets analyst committed to delivering high-quality, actionable insights tailored to traders, investors, and crypto enthusiasts. He enjoys deep dives into emerging Web3 tren




