Ethereum price eyes a 13% drop to $1,050, will ETH bulls idle?
- Ethereum price is traversing a bear flag pattern that forecasts a continuation of the bearish trend.
- This setup hints at a 13% drop to $1,050 on a confirmation of the breakout.
- A four-hour candlestick close above $1,266 will invalidate the bearish outlook.

Ethereum price has been steadily consolidating in an upward trend, which, when considered alongside the bearish crash preceding it, suggests that this trend may continue. Therefore investors need to be cautious with ETH in the coming days.
Ethereum price reveals its plans
Ethereum price dropped 13% between December 14 and 16, 2022, denoting the end of a volatile move. This plummet was quickly followed by a lofty attempt at recovery that led to a consolidation in the form of higher highs and higher lows.
Together, this price action for ETH between December 14, 2022 and January 4 has led to the formation of a bearish flag. While the initial 13% drop is termed as the flagpole, the tight consolidation that followed is known as the flag.
This technical formation for Ethereum price forecasts a 13% drop to $1,050, which is obtained by adding the flagpole’s height to the breakout point. Although ETH has not breached the flag, investors can assume it could happen around $1,205.
So a four-hour candlestick close in Ethereum price below the said level will indicate the start of a downtrend for ETH holders. In such a case, the smart contract token could sweep the equal lows at $1,071 for sell-stop liquidity and call it a day.
However, in the case of a highly bearish outlook, Ethereum price might continue its descent to retest the theoretical target at $1,050.
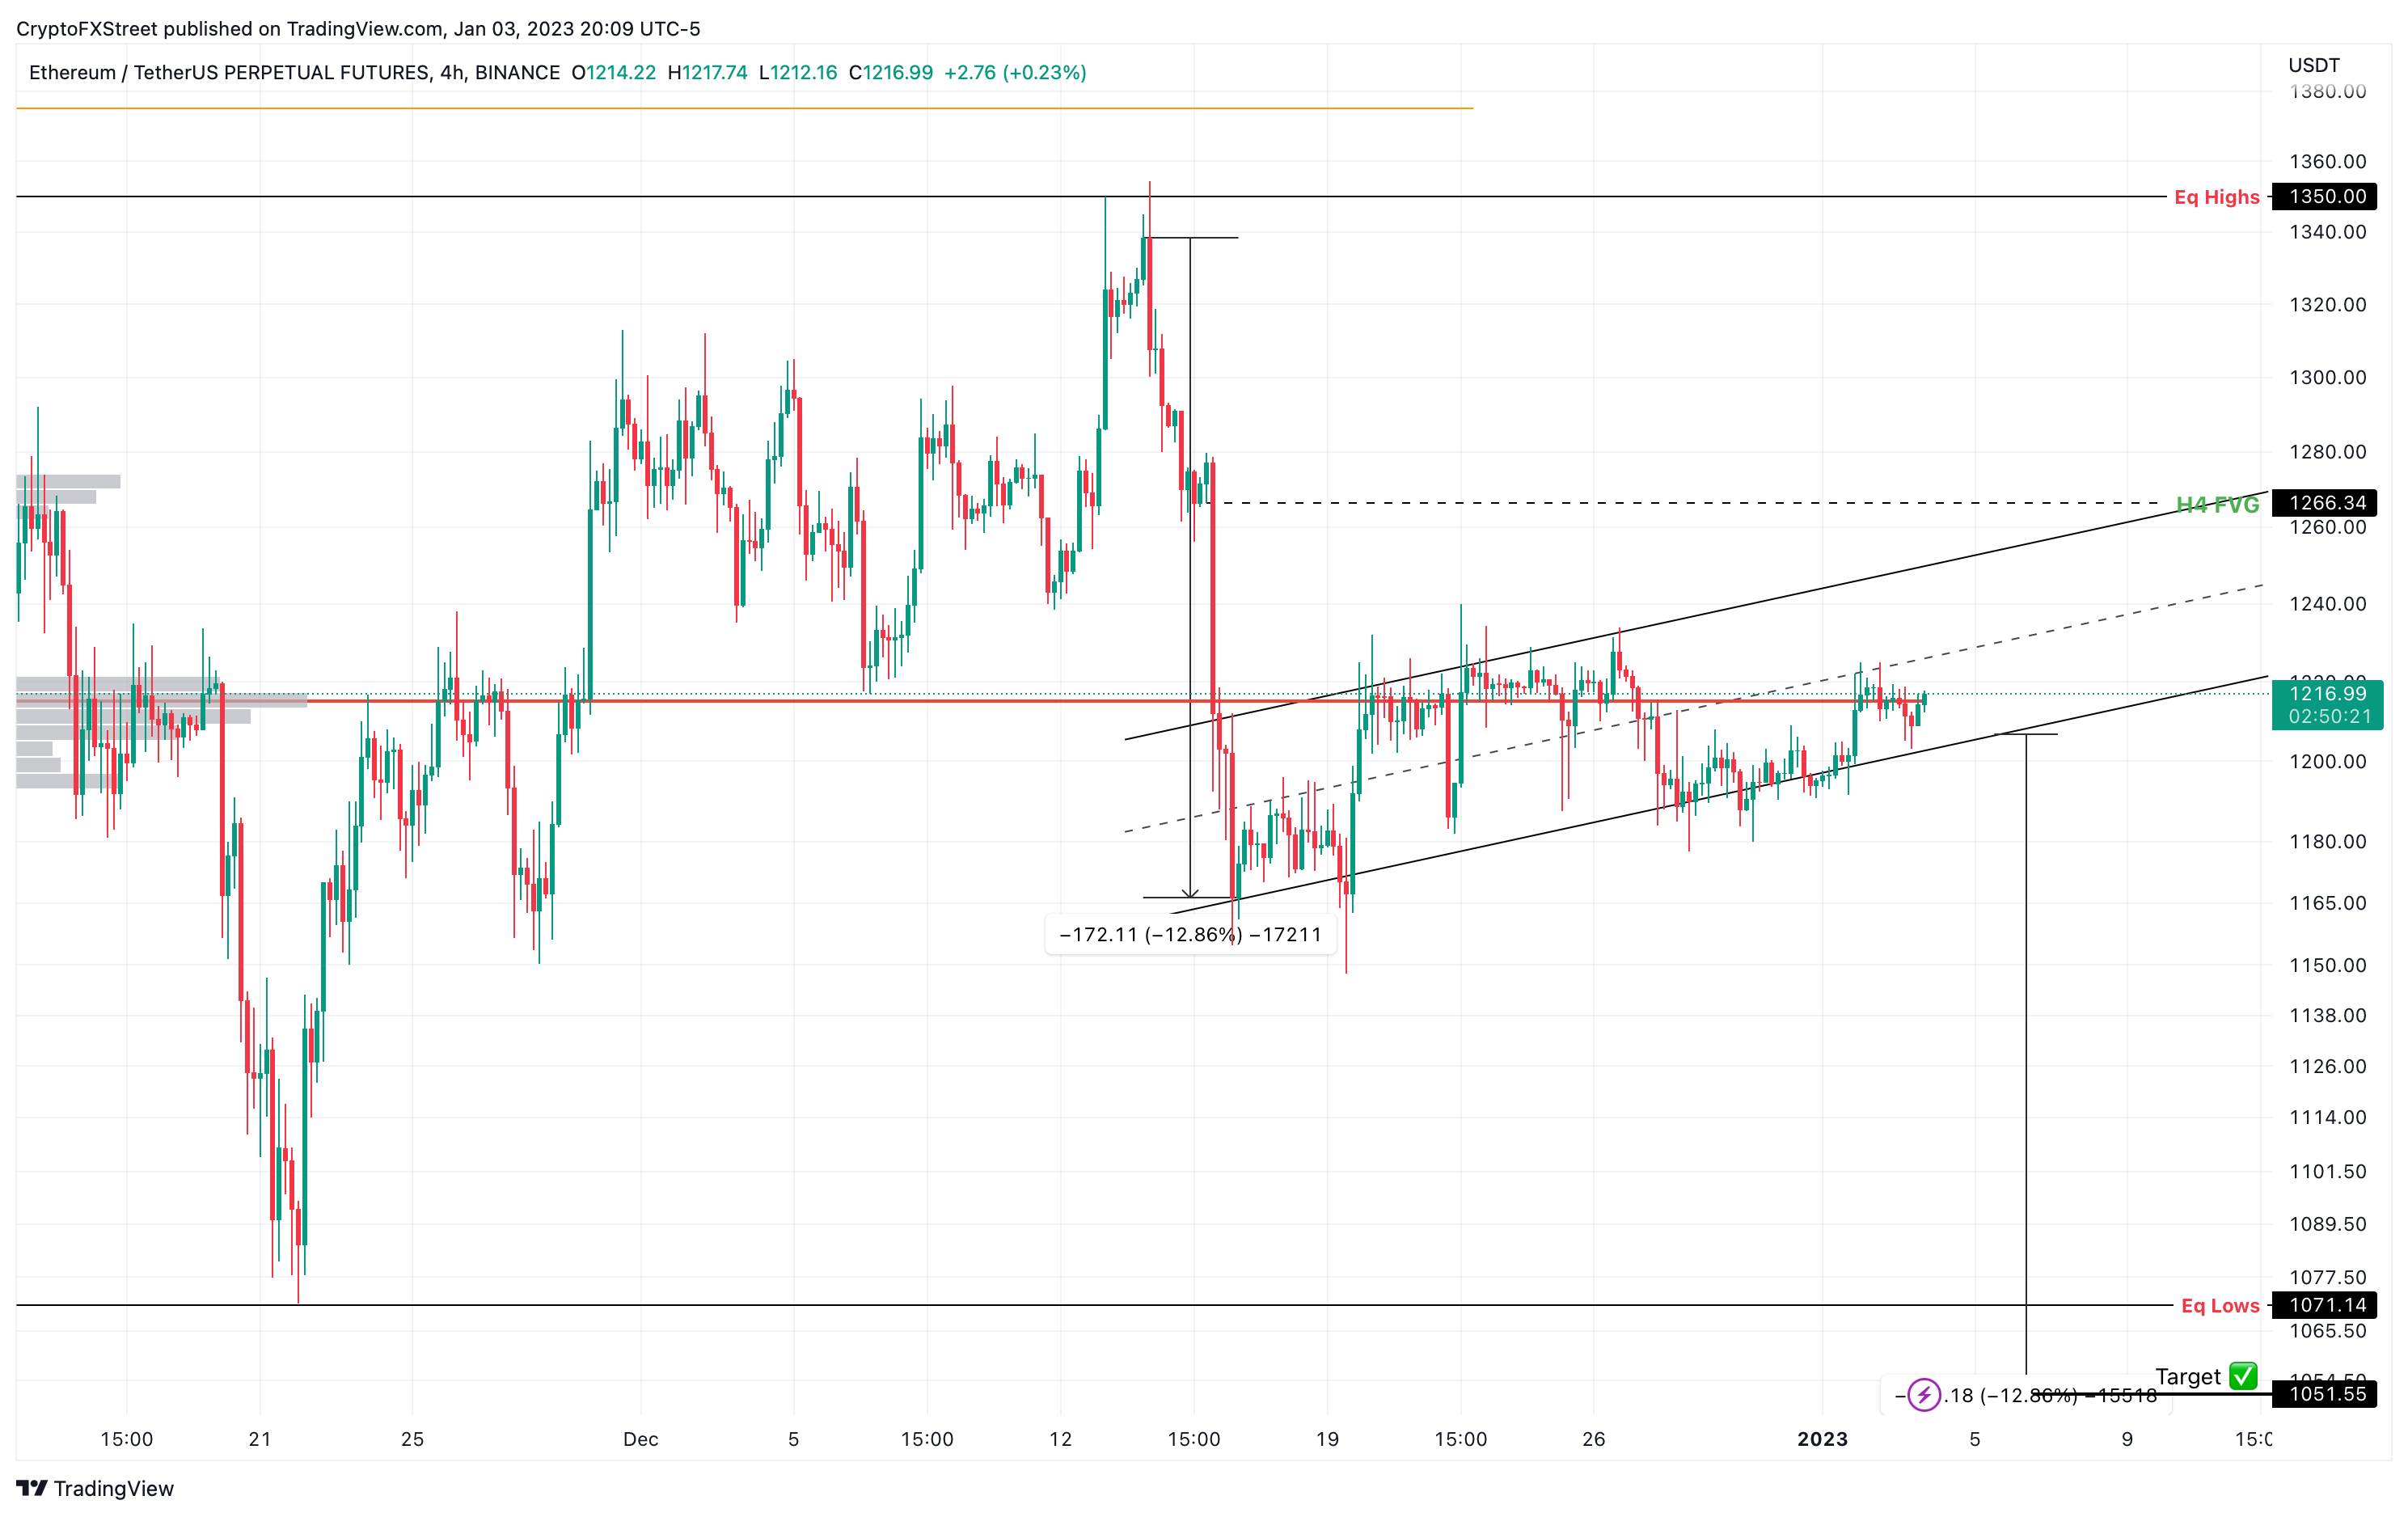
ETH/USDT 4-hour chart
On the other hand, if Ethereum price produces a four-hour candlestick close above $1,266, it will have breached the flag’s upper limit and consequently invalidate the bearish outlook. This development could trigger a bulllish move that could which propels ETH to the equal highs at $1,350.
Author

Akash Girimath
FXStreet
Akash Girimath is a Mechanical Engineer interested in the chaos of the financial markets. Trying to make sense of this convoluted yet fascinating space, he switched his engineering job to become a crypto reporter and analyst.



