Ethereum price shows volatility at lowest since 2016, here's a potential signal for a market reversal
- Ethereum price has been trading within a 6% range for several weeks.
- On-chain analysis shows the weekly volatility at its lowest in six years.
- Using the weekly volatility indicators correctly could improve investors' opportunity costs in 2023.

Ethereum price is at a standstill as bulls and bears wrestle over minute price levels in the $1,200 region. On-chain analysis shows the tug-of-war price action is likely to continue.
Ethereum price needs volatility
Ethereum price has slowed down the erratic swinging behavior witnessed throughout 2022. Since December 19, the decentralized smart-contract token has been confined to a tightening range, ricocheting back and forth between $1,150 and $1,225. The 6% range has led traders to adopt a sidelined approach as the market provides fewer swing trading opportunities as the days progress.
Ethereum price currently auctions at $1,207. Santiment’s on-chain analysis tools provide further context for ETH’s lackluster price action. According to the new 2-week Price Volatility Indicator, ETH’s network liquidity has fallen to new all-time lows. According to the indicator, the average swing trade accumulates 0.01 ETH, the lowest reading in the Network's history this decade.
The last time ETH’s liquidity was in the 0.01 ETH range was August 24, 2016. Ethereum would decline from $11.67 to $ 7.53 before creating enough liquidity in the market to spark an upward market reversal. A similar 35% decline in current market would land Ethereum near $780.
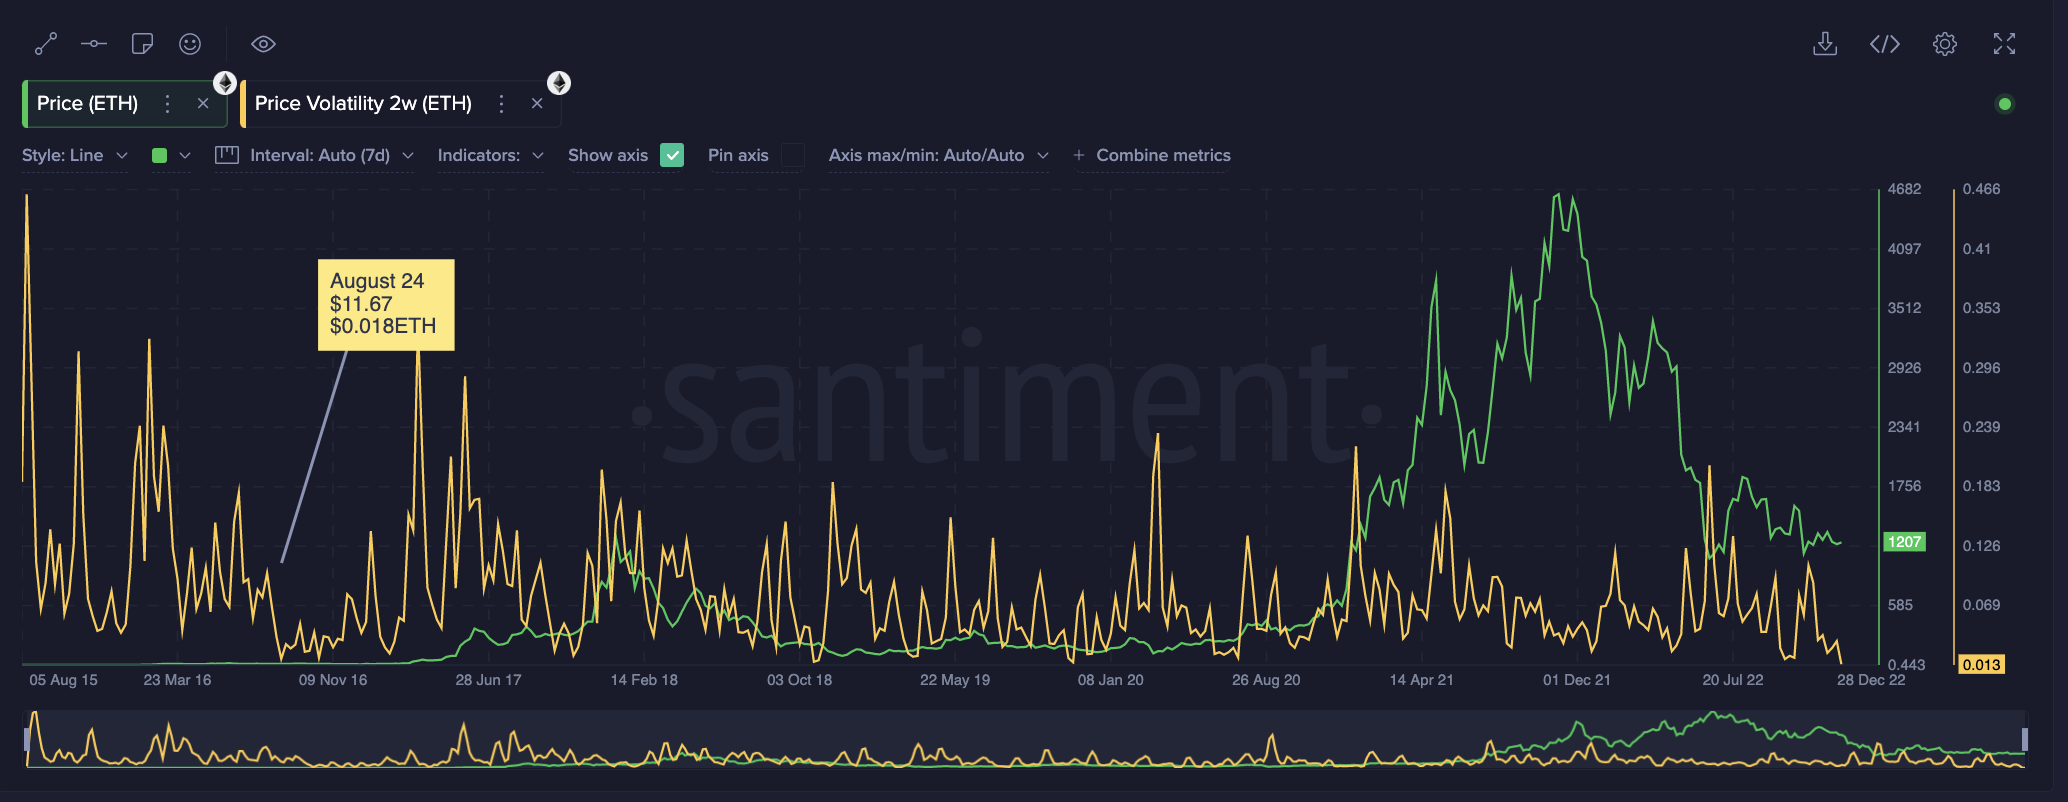
Traders should consider keeping an eye on Ethereum's Volatility indicators before engaging in a buy-the-dip opportunity. Historically ETH's average liquidity 2-week ranges between 0.03-0.05 ETH for several weeks before a market reversal occurs. Ideally, a trader would maximize their opportunity cost and avoid getting trapped in stalemate price action if the indicator was correct.
Author

Tony M.
FXStreet Contributor
Tony Montpeirous began investing in cryptocurrencies in 2017. His trading style incorporates Elliot Wave, Auction Market Theory, Fibonacci and price action as the cornerstone of his technical analysis.



