Ethereum price dilemma or buy signal before 60% rally
- Ethereum price consolidates on the weekly chart inside an ascending triangle.
- A successful breakout from this setup forecasts a 43% upswing to $2,943.
- But ETH could rally ahead and tag the MRI’s resistance level of $3,186.

Ethereum (ETH) price shows a tightening of the multi-month consolidation. A breakout from this sideways movement could trigger a volatile move to the upside.
Also read: Ethereum is a commodity, but SEC will not admit it, expert says amid ongoing ETF race
Ethereum price edges closer to breakout
Ethereum price has set up three higher lows and three roughly equal highs since June 2022. Connecting these swing points using trend lines, reveals an ascending triangle setup. A decisive weekly candlestick close above the triangle’s horizontal resistance level at $2,000 will signal a breakout.
In such a case, this technical formation forecasts a 43% rally to $2,943, obtained by measuring the distance between the first swing high and swing low to the breakout point of $2,000.
Currently, Ethereum price sits above the Momentum Reversal Indicator’s (MRI) resistance level of $1,936 and below the ascending triangle’s horizontal resistance level. From the looks of it, ETH seems to have flipped the $1,936 hurdle into a support floor.
If Bitcoin price does not crash wildly in the upcoming weeks, Ethereum price is set to break out and kickstart an upswing to $2,943. But this move is likely to face resistance around the $2,539 hurdle, which served as a critical support level in March 2022.
While $2,943 is the theoretical target, ETH could rise higher and tag the next MRI resistance level of $3,186. This move would constitute a 60% gain.
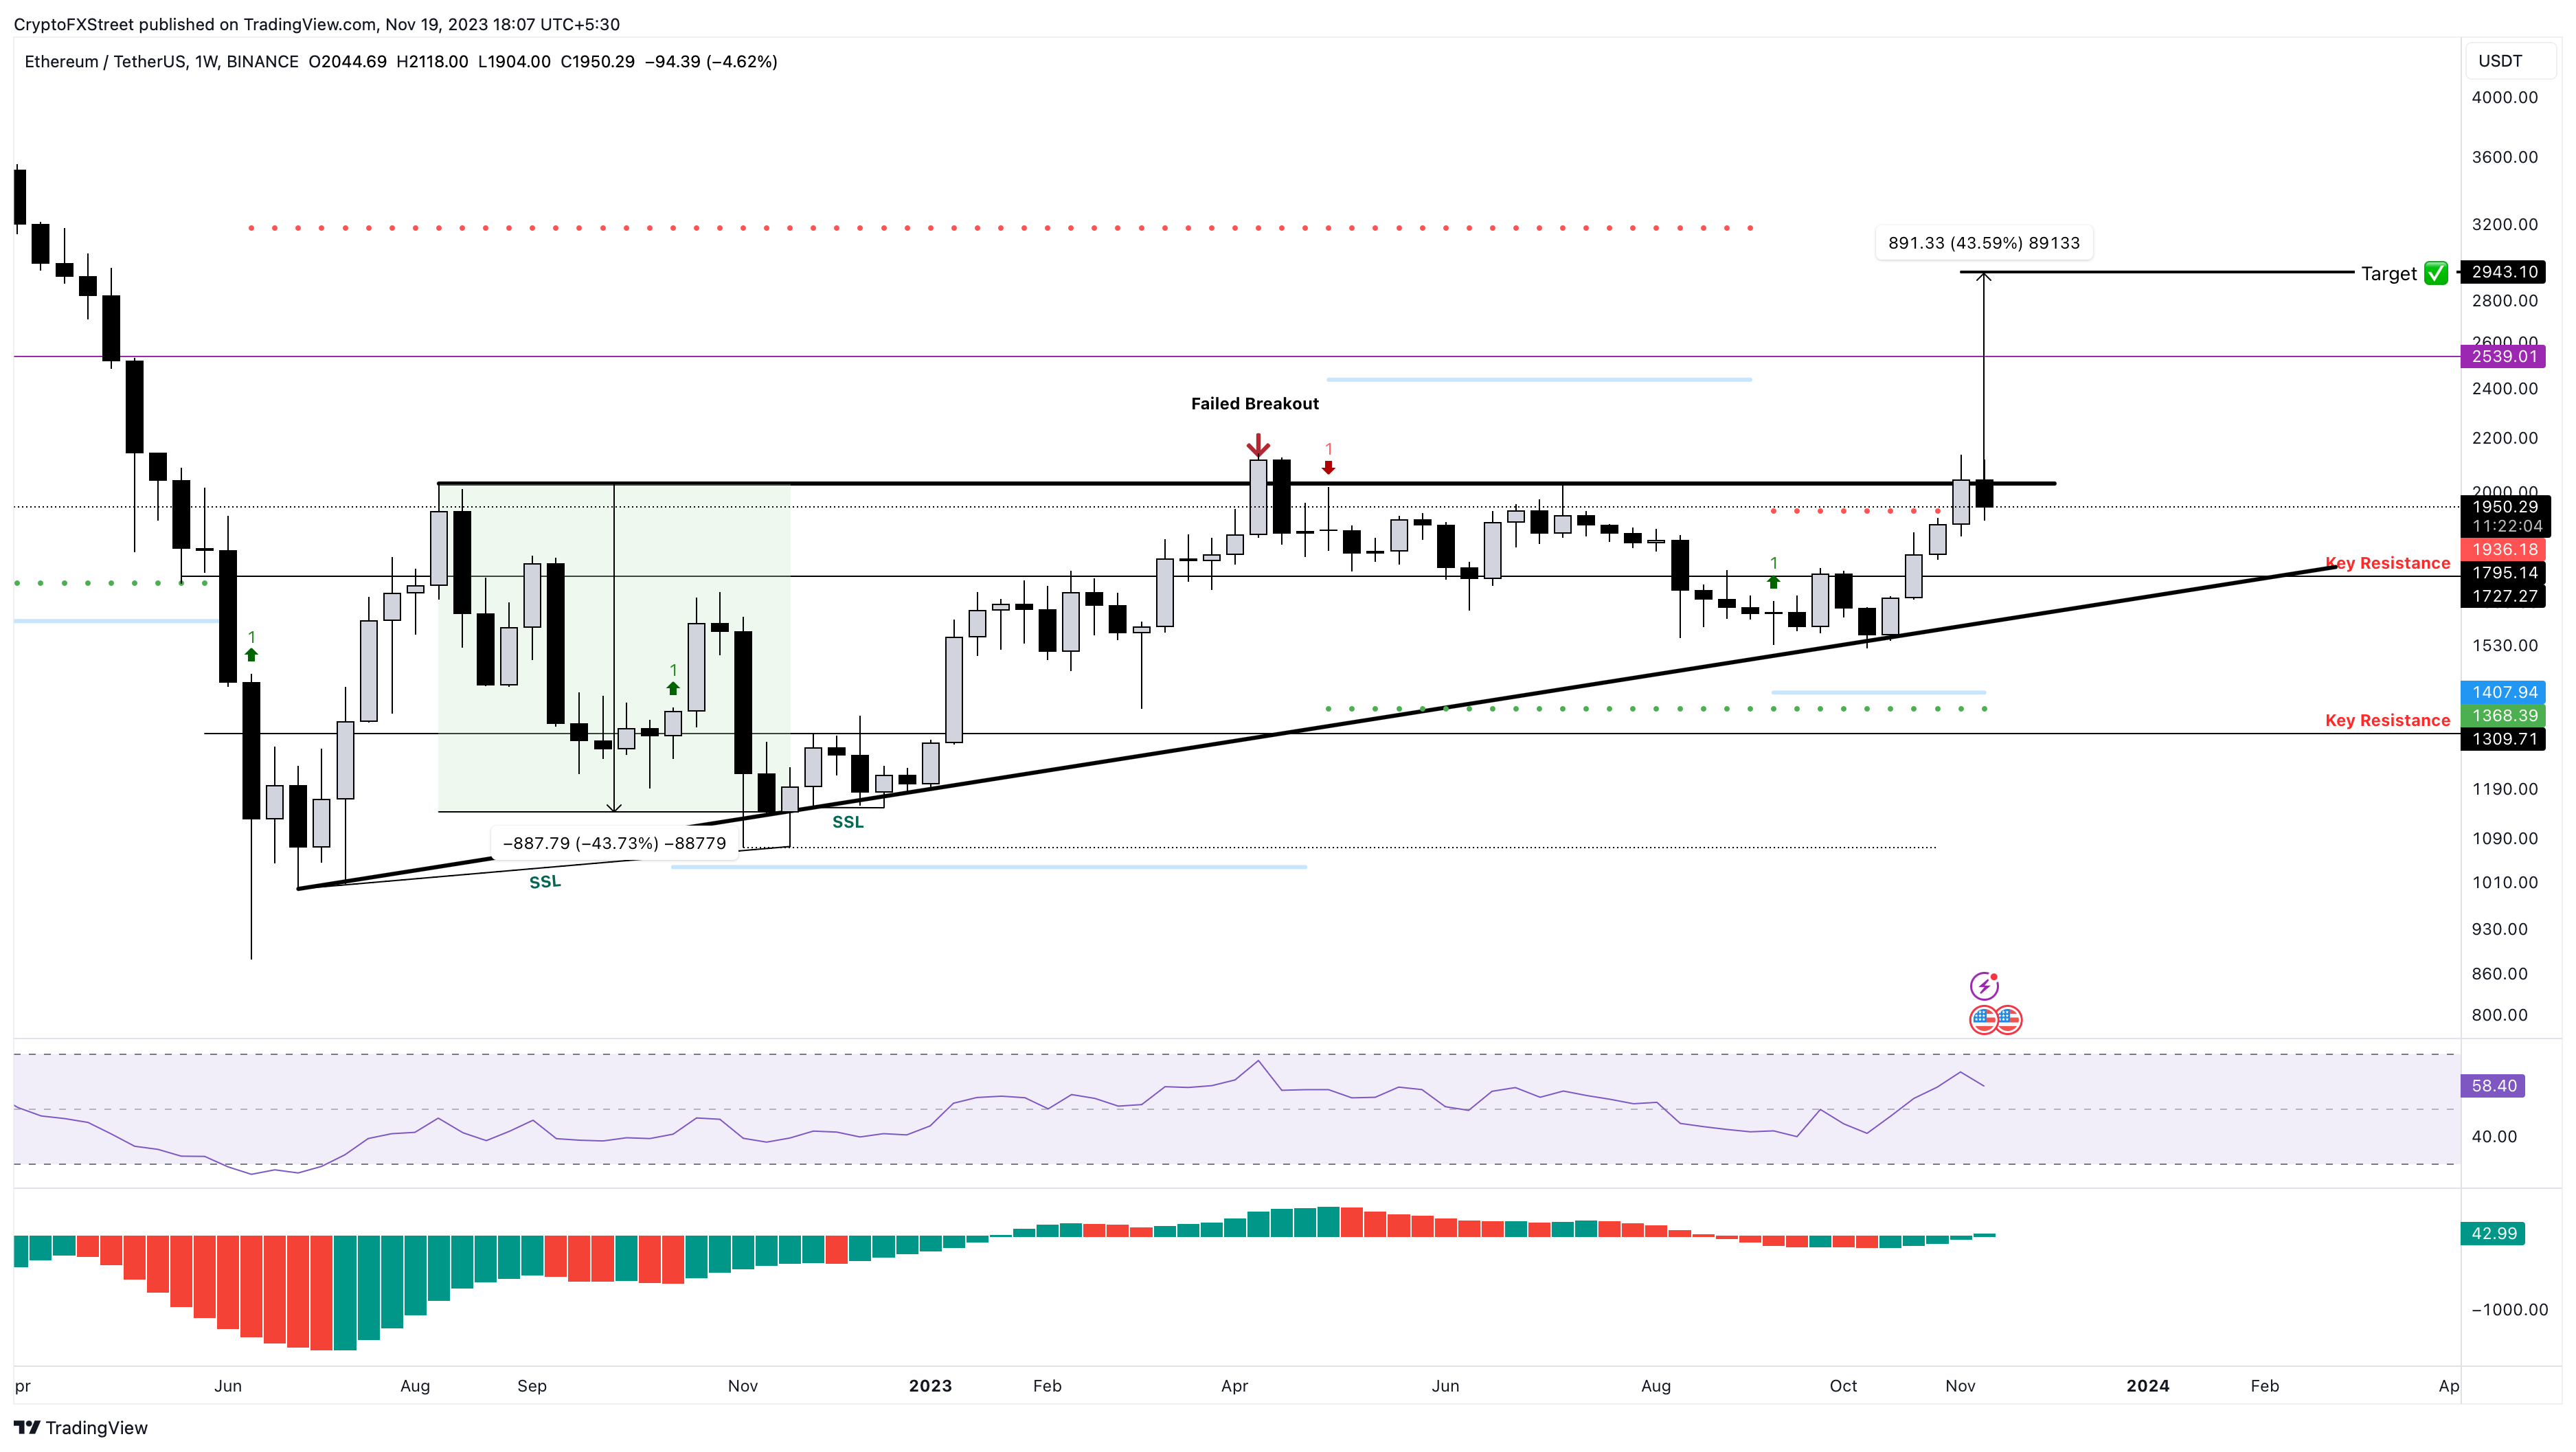
ETH/USDT 1-week chart
On the other hand, if Ethereum price fails to stay above the $1,936 support level, it could trigger a correction down to the $1,795 support floor, where buyers could give the breakout another go.
But if this attempt fails and Ethereum price produces a weekly candlestick close below $1,547, it will create a lower low and invalidate the bullish thesis. In such a case, ETH could slide as low as $1,309.
Also read: BlackRock’s spot Ethereum ETF filing fails to catalyze ETH price sustained rally
Author

Akash Girimath
FXStreet
Akash Girimath is a Mechanical Engineer interested in the chaos of the financial markets. Trying to make sense of this convoluted yet fascinating space, he switched his engineering job to become a crypto reporter and analyst.




