Ethereum price could target $3,000 with ETH whales buying the dip
- Ethereum price has shown interest in a recovery rally, trading around $2,244.
- A spike in whale transaction count suggests investors could be buying the dip.
- On-chain metrics hint at little to no resistance up to $2,800.
- A flip of the $2,145 level into the resistance level will invalidate the bullish thesis.

Ethereum (ETH) price is attempting a recovery bounce that could kickstart a run-up to new yearly highs. Supporting on-chain and technical indicators add credence to this bullish ETH outlook.
Also read: Institutions’ interest in crypto grew by 176% in 2023 but seems to be waning ahead of Bitcoin ETF
Ethereum price ready to move higher
Ethereum price slipped low as $2,100 on January 3 after Matrixport’s ETF-rejection post. But ETH, like many other cryptocurrencies, recovered quickly. Ether currently trades at $2,244, forecasting a potentially explosive move to the upside.
The Relative Strength Index (RSI) hovers around 42 after its recovery from the oversold region a few days ago. A higher low formation could indicate a slow but steadily gaining upward momentum.
The Awesome Oscillator (AO) is much more optimistic than the RSI, which shows a decline in bearish momentum as the indicator approaches the zero line. A flip of the mean level would indicate that the bullish momentum is in play and could push Ethereum price higher.
In such a case, if Ethereum price flips the $2,300 hurdle into a support floor, it could move higher and retest the $2,400 barrier. In a highly bullish case, ETH could tag the 161.8% Fibonacci level at $2,562 and also the monthly resistance level at $2,652.
Read more: Ethereum price could make a recovery as ETH supply on exchanges hits an all-time low
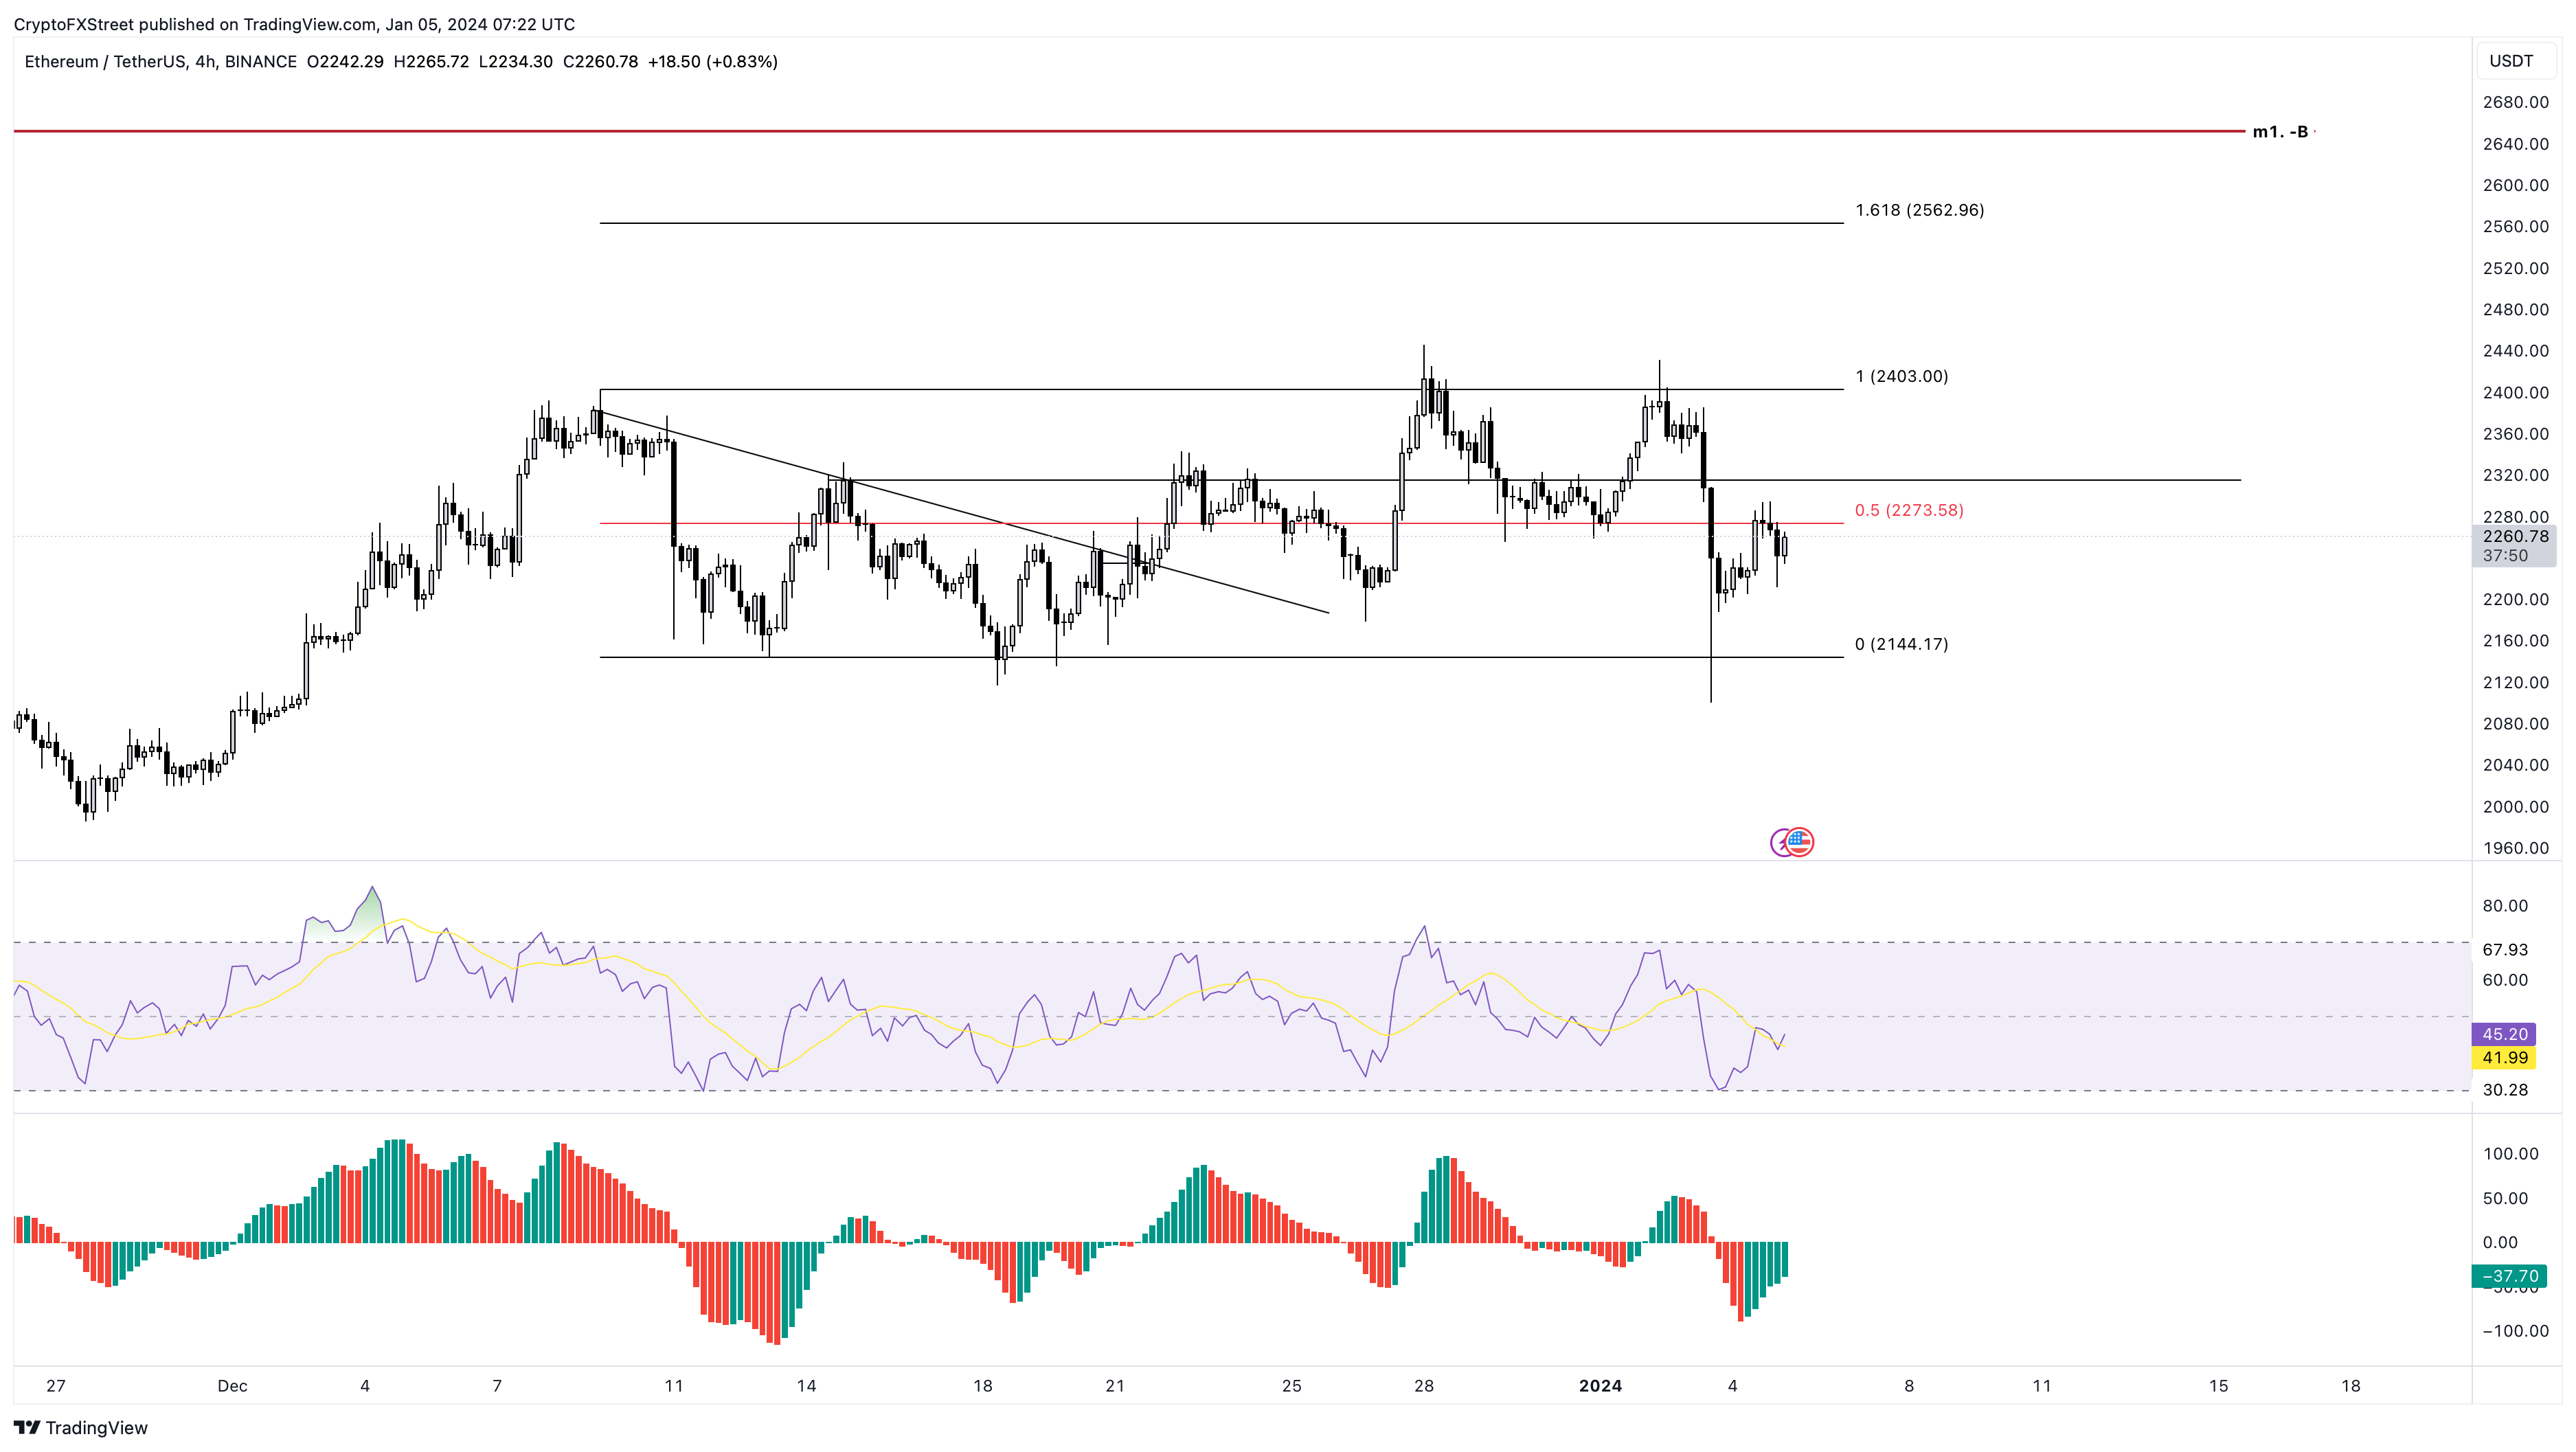
ETH/USDT 1-day chart
The bullish Ethereum price outlook is supported by the spike in Whale Transaction Count and Volume on January 3. According to Santiment’s data, this uptick occurred on the day of a massive sell-off, which is a sign of investors buying the dip.
Since whale-transaction count tracks transfers worth $100,000 or more, this uptick has a high chance of being a buy-the-dip move from institutional investors. Considering that the volume coincides with this uptick adds even more credence to the bullish outlook.
 [12.26.32, 05 Jan, 2024]-638400366850815734.png)
ETH whale transaction count, volume
Furthermore, IntoTheBlock’s Global In/Out of the Money (GIOM) indicator shows that the immediate key hurdle at $2,347 is relatively weak. Hence, overcoming this blockade could send ETH to the next critical level of $2,859. Here, roughly 10.77 million addresses that accumulated 5.2 million Ether are sitting at a loss.
Therefore, a potential move into this hurdle could see a considerable spike in selling pressure from these holders trying to break even.

ETH GIOM
On the other hand, if Ethereum price flips the range low of $2,144, it will create a lower low and invalidate the bullish thesis. In such a case, ETH could slide 6.50% and revisit the $2,000 psychological level.
Also read: Following spot Bitcoin ETF applicants, SEC holds meetings with NYSE, NASDAQ and other exchanges
Author

Akash Girimath
FXStreet
Akash Girimath is a Mechanical Engineer interested in the chaos of the financial markets. Trying to make sense of this convoluted yet fascinating space, he switched his engineering job to become a crypto reporter and analyst.


