Ethereum price analysis: ETH/USD trading above the descending channel
- Ethereum impressively recovers from $200 major support.
- $220 remains unconquered as the bears push Ethereum towards $210 tentative support.

Ethereum is battling with rising selling pressure on Monday. The entire cryptocurrency market is sliding slightly lower than the recent weekly close. An impressive recovery from the primary support at $200 scaled the levels above the 50 Simple Moving Average 1-hour chart.
A break above the descending channel resistance pushed the price higher. Ethereum stepped above the 100 SMA 1-hour as well as the hurdle at $215. Unfortunately, the price hit pause on forming a high at $216.90.
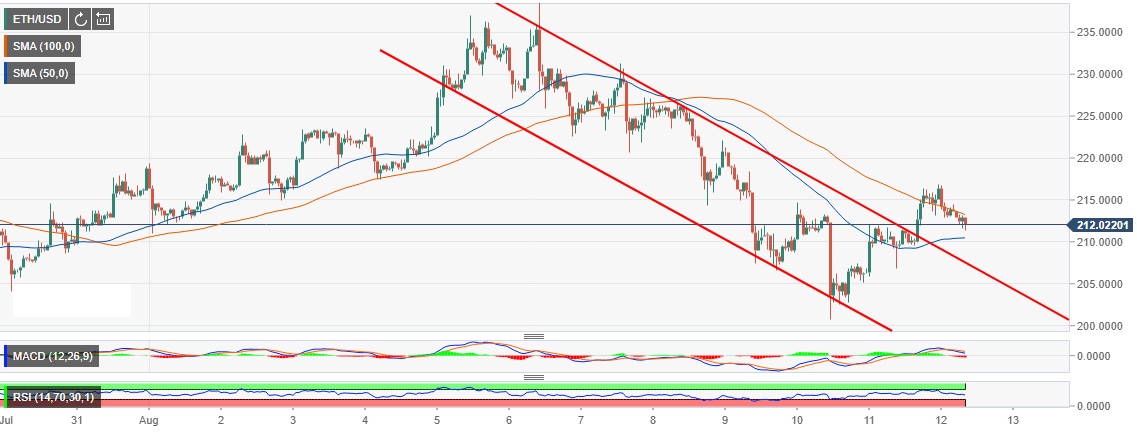
At the moment, Ethereum is trading $211.37 after sliding under 100 SMA. The bearish momentum is staring towards 50 SMA tentative support around $210.
As far as the technicals are concerned, Ethereum is inclined towards making losses. The Moving Average Convergence Divergence (MACD) is still holding within the positive. However, the ongoing negative divergence means that sellers are gaining traction. The Relative Strength Index (RSI) is also heading south after the rejection from levels around 70.
ETH/USD 1-hour chart
Author

John Isige
FXStreet
John Isige is a seasoned cryptocurrency journalist and markets analyst committed to delivering high-quality, actionable insights tailored to traders, investors, and crypto enthusiasts. He enjoys deep dives into emerging Web3 tren


