Ethereum price analysis: ETH/USD bears up and running; $200.00 can be taken out any moment
- ETH/USD bears managed to push the price below $210 support.
- Strong resistance is created by $218-$221 area.

Ethereum, the second-largest cryptocurrency with the current market capitalization of $21.9 billion, is hovering marginally above critical $200,00. The coin tested this area during early Asian hours; however, this barrier remains unbroken so far. ETH/USD is moving within a bearish trend in sync with Bitcoin (BTC) and the rest of the cryptocurrency market. At the time of writing, ETH/USD is changing hands at $204.34, down 5% on a day-on-day basis.
Read also: Ethereum 2.0 January 3, 2020 launch date remains unconfirmed
Ethereum's technical picture
ETH/USD hit the recent high at $135.71 on July 20 and has been moving down ever since.
On the intraday timeframe, ETH/USD is supported by psychological $200,00. Once it is out of the way, the sell-off is likely to gain traction with the next focus on $186 created by SMA200 (Simple Moving Average) on a daily chart. It is followed by the lower line of the 1-day Bollinger Band at $174.80.
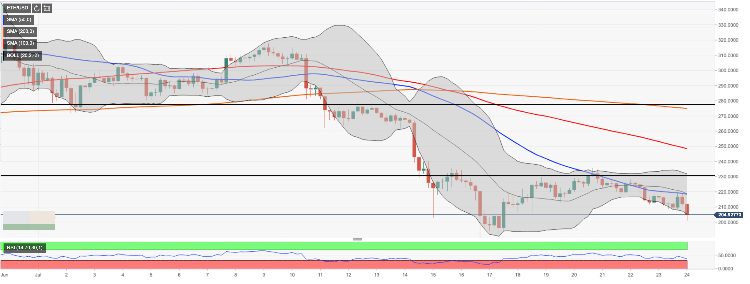
On the upside, the initial resistance comes at $211.40 (the middle line of 1-hour Bollinger Band) and $215.50 (SMA50 1-hour). We will need to see a sustainable move above this area for the upside to gain traction with the next focus on $218.50 (confluence of the middle line of 4-hour Bollinger Band and SMA50). Then comes $220 (the upper line of 1-hour Bollinger Band) and $221 (SMA200 1-hour).
Considering the downward-looking Relative Strength Index (RSO), the bear case scenario looks more likely.
ETH/USD 4-hour chart
Author

Tanya Abrosimova
Independent Analyst


