Ethereum Price Analysis: ETH bulls catch a breather below $1,800, upside bias still intact
- ETH/USD flirts with the previous day’s record top, consolidates off-late.
- Bullish channel, MACD favor buyers targeting a move towards $2,000.
- RSI conditions join immediate resistance to challenge the bulls.

ETH/USD wavers around the mid-1,700s during early Tuesday. In doing so, the altcoin teases the record high of $1,780, flashed the previous day, inside the one-month-old rising channel.
Not only the bullish chart pattern but upbeat MACD and news from the Stablecoin Printer, suggesting that the Tether Printer just coined $1,000,000,000 USDT to mark the total supply of $31,008,167,441, also favor the ETH/USD buyers.
However, an ascending trend line from the last Friday, at $1,787 now, precedes the $1,800 round-figure to guard the quote’s immediate upside.
Also acting as the key hurdle is the upper line of the stated rising channel, currently around $1,825.
Meanwhile, 10-day SMA and 21-day SMA, respectively near $1,600 and $1,445, will entertain the short-term ETH/USD sellers during the cryptocurrency pair’s pullback.
Even if the ETH/USD drops below $1,445, the support line of the channel, at $1,405 now, followed by the $1,400 round-figure, should become the key for the traders as a downside break of which will raise barriers for the current bullish trend.
ETH/USD daily chart
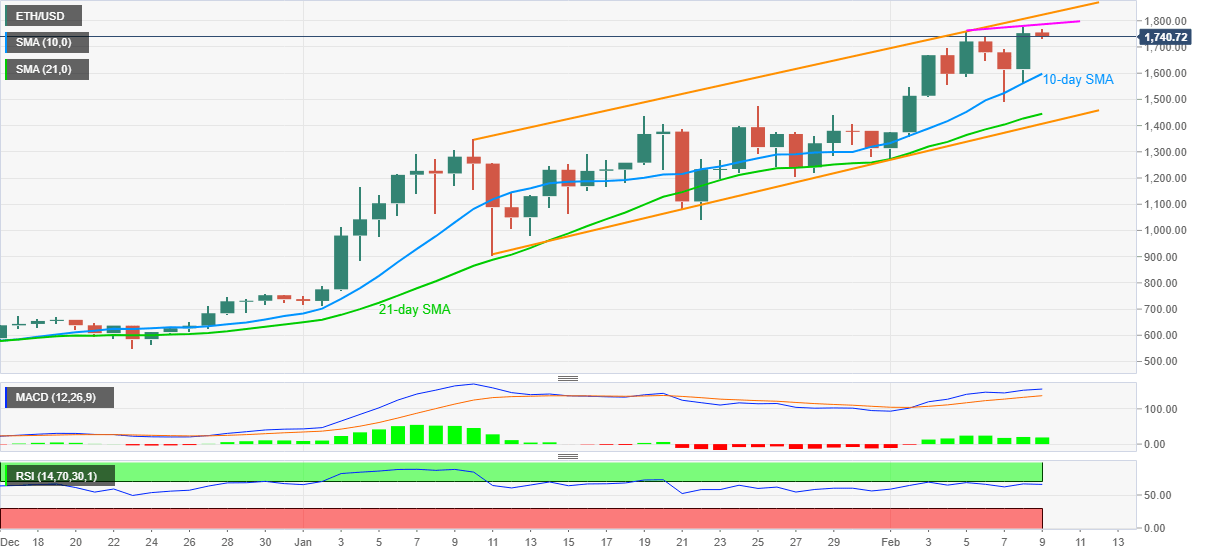
Trend: Bullish
Author

Anil Panchal
FXStreet
Anil Panchal has nearly 15 years of experience in tracking financial markets. With a keen interest in macroeconomics, Anil aptly tracks global news/updates and stays well-informed about the global financial moves and their implications.


