Ethereum poised for recovery following increased exchange outflows
- Ethereum whales bought about 240K ETH after its recent price dip.
- Coinbase Advanced witnessed ETH outflows worth over $1 billion in the past 24 hours.
- Ethereum is looking to enter into key price range following reduced inflation.

Ethereum (ETH) is up more than 3% on Wednesday following huge exchange outflows, increased whale buying pressure and the US Consumer Price Index (CPI) for May reporting reduced inflation.
Daily digest market movers: Massive outflows, Spot ETH updates
After Ethereum's recent dip, whales who hold between 10K to 100K ETH bought over 240K ETH worth about $840 million, according to data from Santiment. Despite the market downturn, this buying activity may be due to bullish events on the horizon like the expectation of spot ETH ETF approvals in the coming weeks.
Read more: Ethereum breaches key support, receives ‘digital oil’ tag from world's largest bank
Following this, about 336K ETH valued at $1.17 billion was withdrawn from Coinbase Advanced, according to data from CryptoQuant. This marks the fifth time in 2024 that the exchange has seen a single-day outflow of 150K ETH and above. If the outflow isn't an internal exchange movement, it could signify highly bullish momentum for Ethereum.
A CryptoQuant analyst noted that a similar activity occurred on Coinbase before spot Bitcoin ETFs went live. Hence, the move may be from whales or institutions anticipating a rise in ETH's price when/if spot Ethereum goes live in the coming weeks.
On the ETF front, Nate Geraci, president of the ETF Store, says he'll be "surprised" if the Securities & Exchange Commission (SEC) has yet to approve spot ETH ETFs S-1s by the end of June, as most of the critical issues have already been sorted out during the launch of ETH futures ETFs and spot Bitcoin ETFs.
— Nate Geraci (@NateGeraci) June 12, 2024
Meanwhile, ProShares submitted an S-1 draft for its spot ETH ETF on Tuesday after the SEC added the company's 19b-4 filings to its website.
The SEC approved eight issuers' 19b-4 spot ETH ETF applications on May 23, including BlackRock, VanEck, Franklin Templeton, Invesco & Galaxy, Grayscale, Bitwise, Fidelity and 21Shares. ProShares later signaled its intention to join the ETH ETF party when it filed a 19b-4 application on June 6.
ETH technical analysis: Ethereum poised to rise into weekly range
Ethereum is trading around $3,619 on Wednesday after Consumer Price Index (CPI) data came at 3.3%, lower than the 3.4% analysts' expectations.
The 7-day moving average of the ETH Taker Buy Sell Ratio, which measures the relative volume of perpetual derivatives buyers versus sellers, provides insights into the current sentiment among ETH derivatives traders. A value over 1 indicates prevailing bullish sentiment, while a value below 1 shows bearish sentiment is dominant.
-638538056335285483.png)
ETH Taker Buy Sell Ratio
According to data from CryptoQuant, the ratio has been declining since the past week, failing to push above 1, indicating derivatives traders have been selling.
Read more: Is Ethereum price forming a local top?
The positive CPI data may cause a shift in the ratio if a larger percentage of the market takes it as a bullish signal.
Looking at ETH 12-hour liquidations, over $10 million in short positions have been wiped off the market compared to only $1.8 million in long positions. This shows that the tide is shifting in favor of bulls.
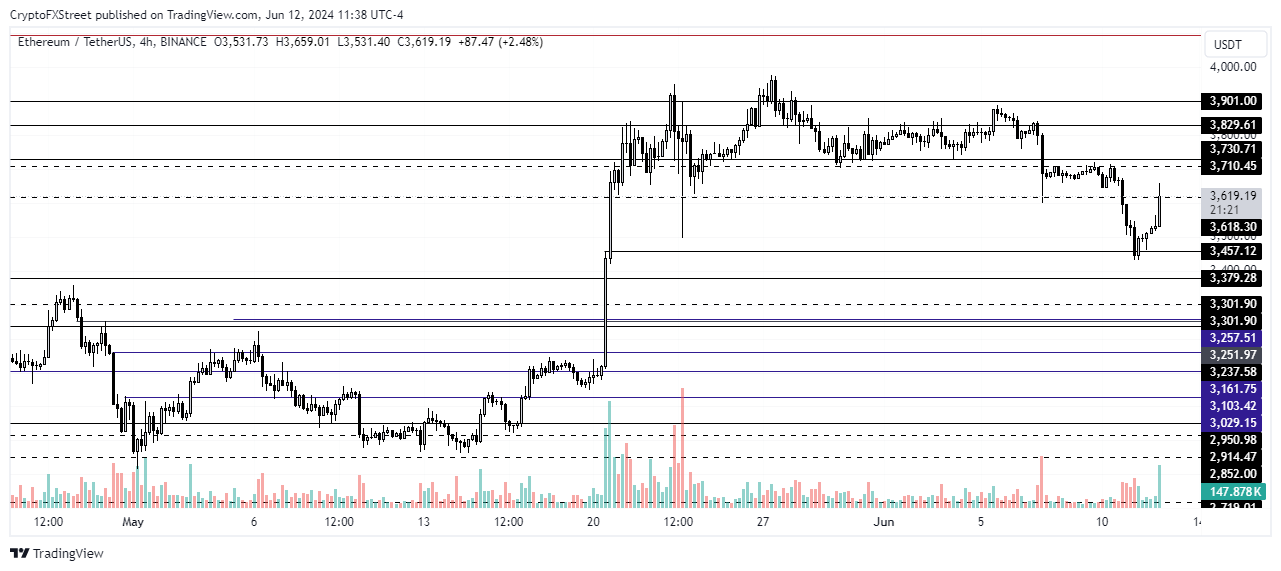
ETH/USDT 4-hour chart
If the bullish sentiment prevails, ETH will likely enter the price range of $3,710 to $3,900 within the next day. A drop below the $3,457 level will invalidate the bullish thesis.
Cryptocurrency metrics FAQs
The developer or creator of each cryptocurrency decides on the total number of tokens that can be minted or issued. Only a certain number of these assets can be minted by mining, staking or other mechanisms. This is defined by the algorithm of the underlying blockchain technology. Since its inception, a total of 19,445,656 BTCs have been mined, which is the circulating supply of Bitcoin. On the other hand, circulating supply can also be decreased via actions such as burning tokens, or mistakenly sending assets to addresses of other incompatible blockchains.
Market capitalization is the result of multiplying the circulating supply of a certain asset by the asset’s current market value. For Bitcoin, the market capitalization at the beginning of August 2023 is above $570 billion, which is the result of the more than 19 million BTC in circulation multiplied by the Bitcoin price around $29,600.
Trading volume refers to the total number of tokens for a specific asset that has been transacted or exchanged between buyers and sellers within set trading hours, for example, 24 hours. It is used to gauge market sentiment, this metric combines all volumes on centralized exchanges and decentralized exchanges. Increasing trading volume often denotes the demand for a certain asset as more people are buying and selling the cryptocurrency.
Funding rates are a concept designed to encourage traders to take positions and ensure perpetual contract prices match spot markets. It defines a mechanism by exchanges to ensure that future prices and index prices periodic payments regularly converge. When the funding rate is positive, the price of the perpetual contract is higher than the mark price. This means traders who are bullish and have opened long positions pay traders who are in short positions. On the other hand, a negative funding rate means perpetual prices are below the mark price, and hence traders with short positions pay traders who have opened long positions.
Author

Michael Ebiekutan
FXStreet
With a deep passion for web3 technology, he's collaborated with industry-leading brands like Mara, ITAK, and FXStreet in delivering groundbreaking reports on web3's transformative potential across diverse sectors. In addition to



