Ethereum tops crypto projects with high developer activity, key trendline suggests decline to $2000
- Ethereum is the most actively developed crypto project, per Santiment data.
- Centralization of ETH within a few wallets not bearish but signals high staking activity.
- Ethereum crossed below a key trendline that suggests its price could decline toward $2,000.
Ethereum (ETH) is down 0.5% on Friday, following recent data showing it is the most actively developed crypto project. ETH also ranks among the top centralized cryptocurrencies by supply concentration.
Daily digest market movers: ETH ETF outflows, high DevActivity, increased staking
Ethereum ranks first among the top crypto projects in terms of development activity, per Santiment data. While developer activity declined by 0.6% in the past month, its DevActivity events crossed 180K.
The number two project with the most DevActivity, BNB Chain, ranks far behind with only 90.1K events. High DevActivity within a project often translates to its technology growth, which could positively impact price.
Top Crypto Projects by Developer Activity
Santiment data also ranks Ethereum fifth among the top centralized cryptocurrencies. Centralization here refers to concentrated mining power among a few stakeholders or most of a coin's supply residing within a few wallets.
In Ethereum's case, Santiment data shows that 44% of its supply resides within ten key wallets. While the centralization of tokens within a few wallets is often interpreted as a bearish signal, Ethereum's can be considered bullish. Most of its large holders are staking platforms that allow investors to contribute to Mainnet's security and earn yields in return, as noted by Santiment. Also, high staking activity reduces the supply pressure of ETH and can cause price surges during periods of heightened demand.
Meanwhile, Ethereum exchange-traded funds (ETFs) returned to negative flows on Thursday after posting outflows of $1.7 million. Flows were limited to Grayscale's ETHE and ETH Mini Trust, as other issuers recorded neither outflows nor inflows.
In other news, Ethereum co-founder Vitalik Buterin has potentially depleted his ETH holdings from 325K ETH three years ago to 240K ETH worth $592 million as of Friday, per Lookonchain data.
ETH technical analysis: Ethereum falls below key trendline
Ethereum is trading around $2,510 on Friday, down 0.5% on the day. ETH 24-hour liquidation is $43.8 million, with long and short liquidations accounting for $34 million and $9.82 million.
ETH open interest (OI) declined by 5% in the past 24 hours and is currently at $10.39 billion. Open interest is the total worth of unsettled positions in a derivatives market.
Only six days have seen lower OI since May 5. The declining OI shows traders are more cautious, especially after the crash on August 5 wiped out several long positions.
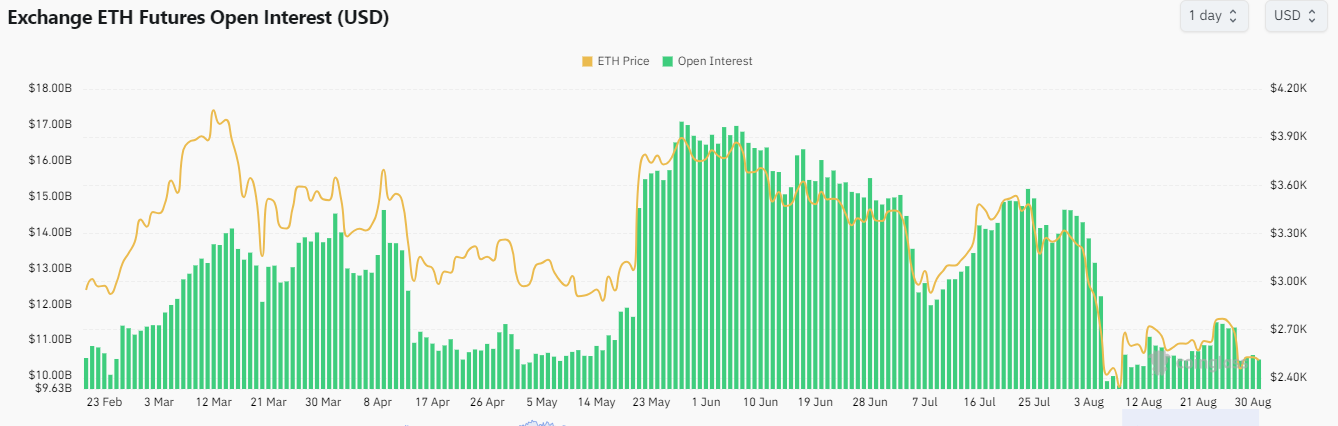
ETH Exchange Open Interest
On the daily chart, ETH has fallen below a descending key trendline extending from May 27 to September 30. The trendline suggests ETH could decline toward the $2,000 to $2,300 range before staging a rally.
ETH posted similar declines from August to November 2022 and July to October 2023 before eventually staging a rally on both occasions. If ETH repeats the same pattern, it could stage a massive rally. On the way up, ETH faces resistance around the horizontal line at $2,817. A successful move above this level could see ETH tackle the resistance at $3,542.
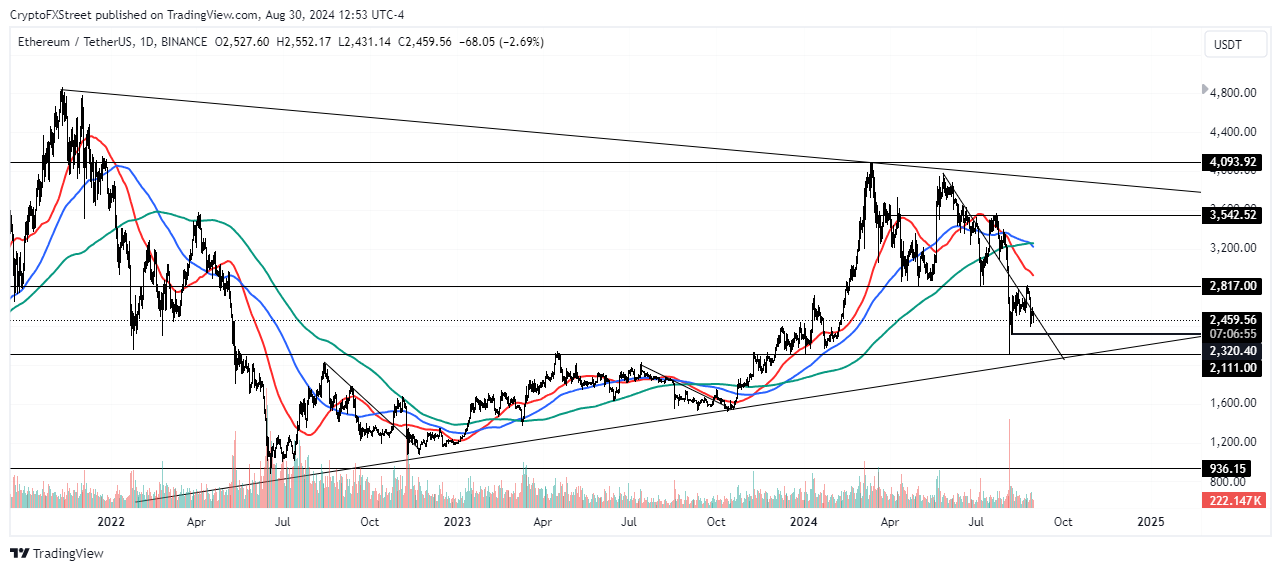
ETH/USDT Daily chart
Meanwhile, ETH is still trading within a key symmetry triangle that extends from November 2021. If ETH rises above the higher descending trendline of the symmetry triangle, it could set a new all-time high.
The Awesome Oscillator (AO) is posting consecutive increasing red bars below the zero line, indicating dominant bearish momentum. The Relative Strength Index (RSI) is at 36 and declining, meaning bearish momentum is prevalent.
A daily candlestick close below the support around $2,111 will invalidate the thesis.
Cryptocurrency metrics FAQs
The developer or creator of each cryptocurrency decides on the total number of tokens that can be minted or issued. Only a certain number of these assets can be minted by mining, staking or other mechanisms. This is defined by the algorithm of the underlying blockchain technology. Since its inception, a total of 19,445,656 BTCs have been mined, which is the circulating supply of Bitcoin. On the other hand, circulating supply can also be decreased via actions such as burning tokens, or mistakenly sending assets to addresses of other incompatible blockchains.
Market capitalization is the result of multiplying the circulating supply of a certain asset by the asset’s current market value. For Bitcoin, the market capitalization at the beginning of August 2023 is above $570 billion, which is the result of the more than 19 million BTC in circulation multiplied by the Bitcoin price around $29,600.
Trading volume refers to the total number of tokens for a specific asset that has been transacted or exchanged between buyers and sellers within set trading hours, for example, 24 hours. It is used to gauge market sentiment, this metric combines all volumes on centralized exchanges and decentralized exchanges. Increasing trading volume often denotes the demand for a certain asset as more people are buying and selling the cryptocurrency.
Funding rates are a concept designed to encourage traders to take positions and ensure perpetual contract prices match spot markets. It defines a mechanism by exchanges to ensure that future prices and index prices periodic payments regularly converge. When the funding rate is positive, the price of the perpetual contract is higher than the mark price. This means traders who are bullish and have opened long positions pay traders who are in short positions. On the other hand, a negative funding rate means perpetual prices are below the mark price, and hence traders with short positions pay traders who have opened long positions.
Author

Michael Ebiekutan
FXStreet
With a deep passion for web3 technology, he's collaborated with industry-leading brands like Mara, ITAK, and FXStreet in delivering groundbreaking reports on web3's transformative potential across diverse sectors. In addition to


