Ethereum fundamentals look stronger than ever making a $7,000 ETH inevitable
- Ethereum price might see a minor correction before visiting the $5,000 psychological level.
- On-chain metrics remain bullish on the long-term outlook while supporting the short-term corrective scenario.
- The effects of London and Altair hard fork will be compounded by the upcoming event “The Merge.”

Ethereum price has been showing strength while the big crypto takes a backseat. This development has allowed ETH to set up a new all-time high. Although this upswing is slow, things will change soon as the smart contract token is likely to shed the weight on a minor retracement before blasting off to new psychological levels.
Ethereum price needs to pull back to blast off
Ethereum price has risen roughly 77% since September 21 and set up a new high at $4,680. As impressive as this ascent is, the Momentum Reversal Indicator flashed a red ‘one’ sell signal once and is currently painting a premature ‘yellow down arrow’ signal on the daily chart.
This technical formation indicates that a continuation of the upswing will likely form a red ‘one’ sell signal that forecasts a one-to-four candlestick correction. Therefore, investors need to watch for a downswing toward the immediate demand zone, extending from $3,888 to $4,222 if the $4,421 support level breaks.
While this correction might seem bearish, it will allow short-term investors to book profit, releasing the weight from the bulls. Hence, this pullback will set the stage for a move that pushes ETH to new highs.
The trend-based Fibonacci extension level at $5,163, or the $5,000 psychological level is the first target that the bulls will lock onto after this retracement as the long-term outlook for ETH continues to remain extremely bullish.
In some cases, the uptrend could continue to the next level at $6,723 or extend toward the $7,000 psychological barrier.
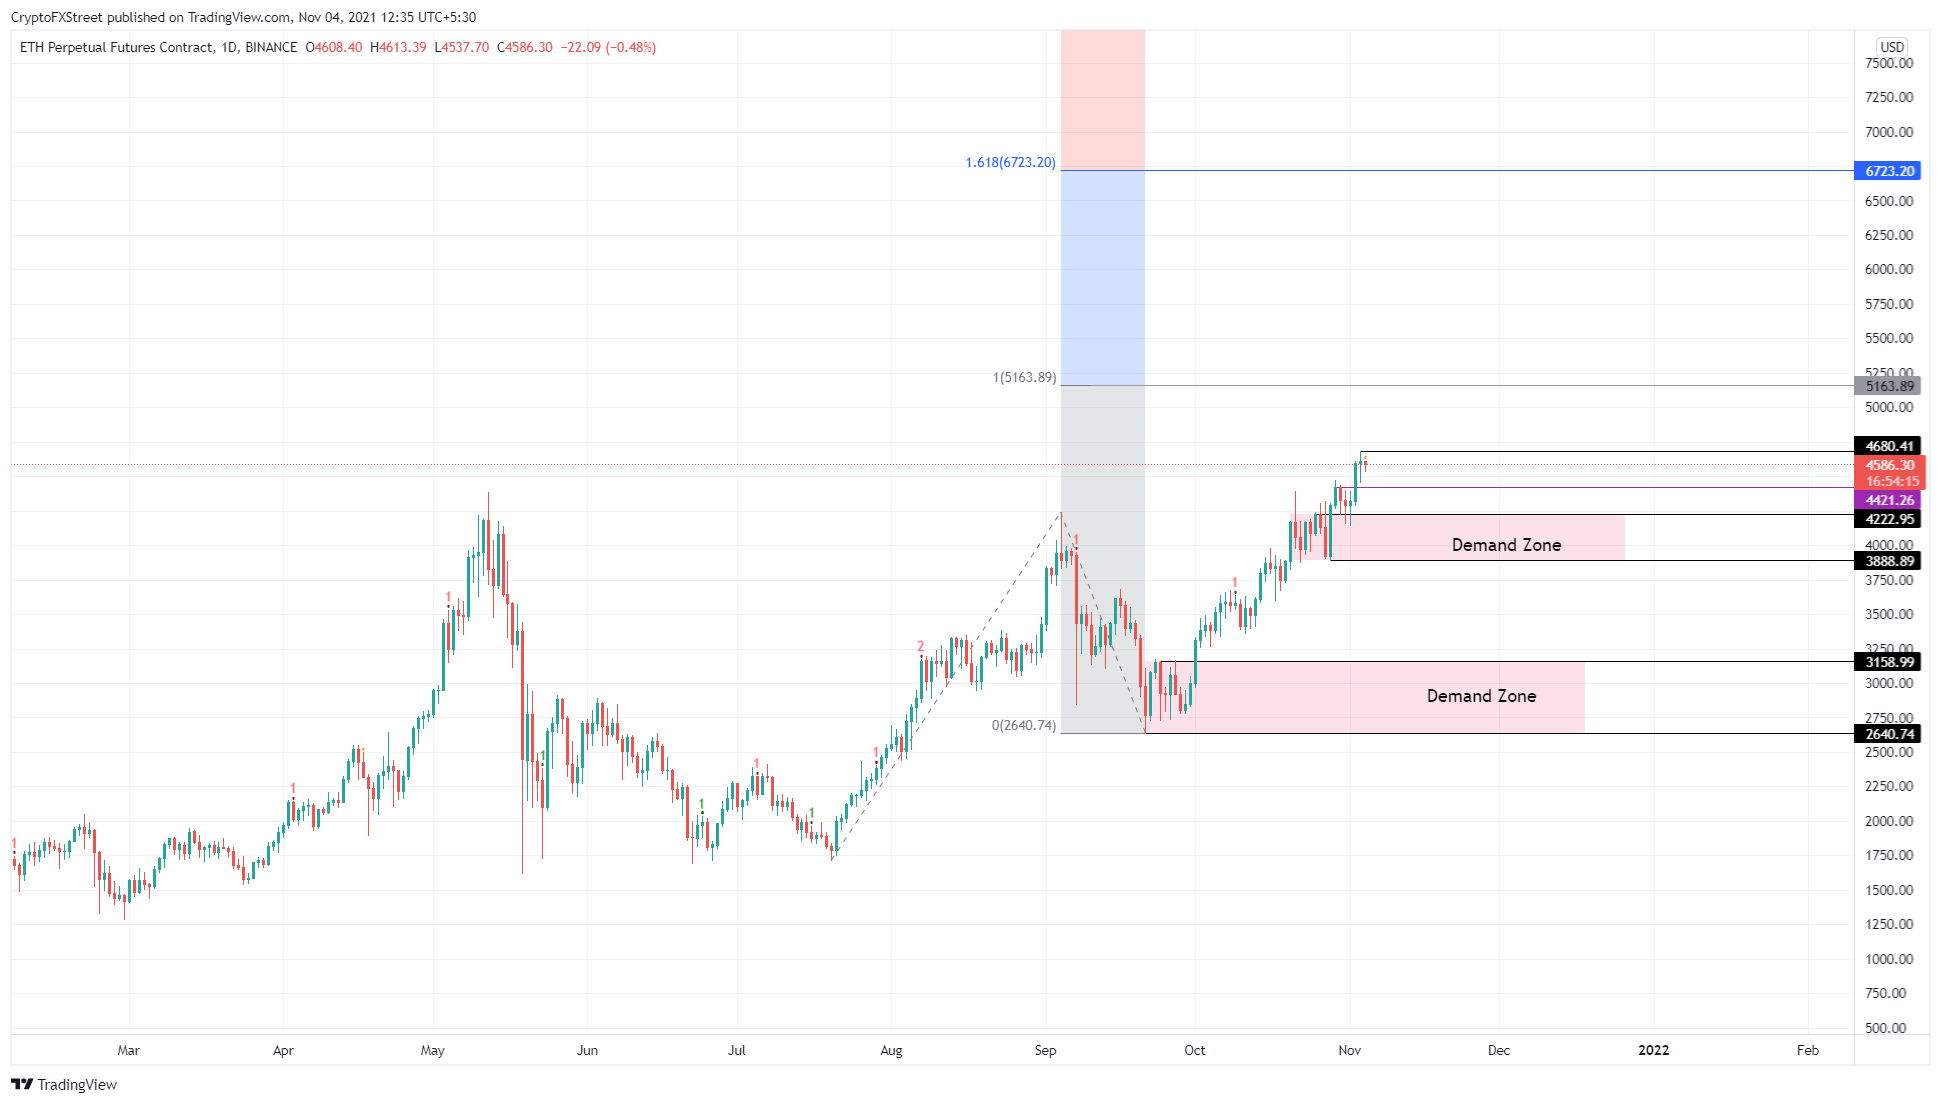
ETH/USDT 1-day chart
Supporting the short-term outlook for ETH is the 30-day Market Value to Realized Value (MVRV) model. This on-chain metric is used to determine the average profit/loss of investors that purchased ETH over the past month.
The fundamental index is at 19, a level ETH previously tagged on September 1 and October 20. On both occasions, ETH price dropped 16.5% and 5.15%, respectively. Technicals are in line with this as they predict a 7% correction to the $3,888 and $4,222 demand zone.
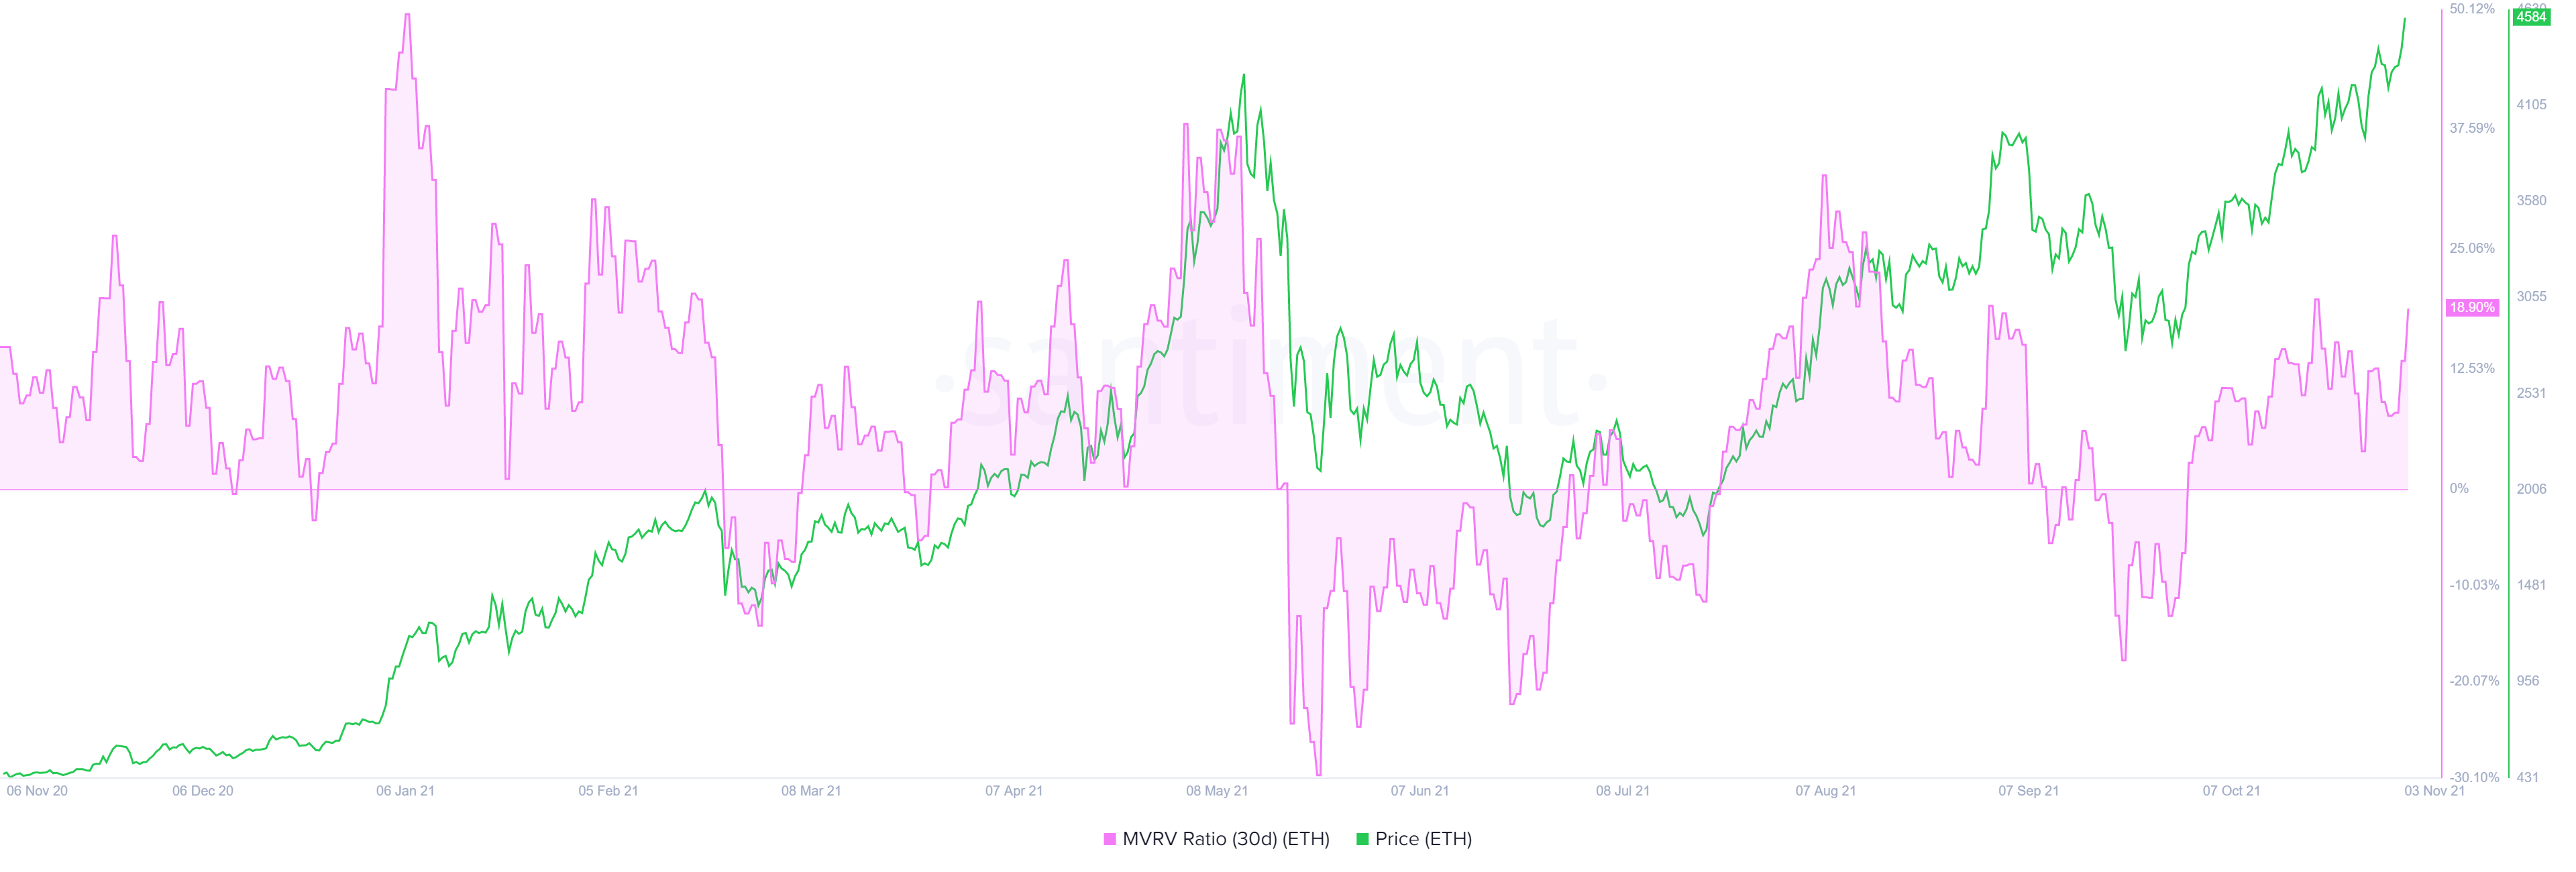
ETH 30-day MVRV chart
Further adding credence to this drop is IntoTheBlock’s In/Out of the Money Around Price (IOMAP) model, which shows little-to-no immediate support for ETH. The stable support level exists at $3,927, where roughly 6.59 million addresses purchased 20.95 million ETH.
Therefore, a downswing, if it arrives, has a high chance of being absorbed here.
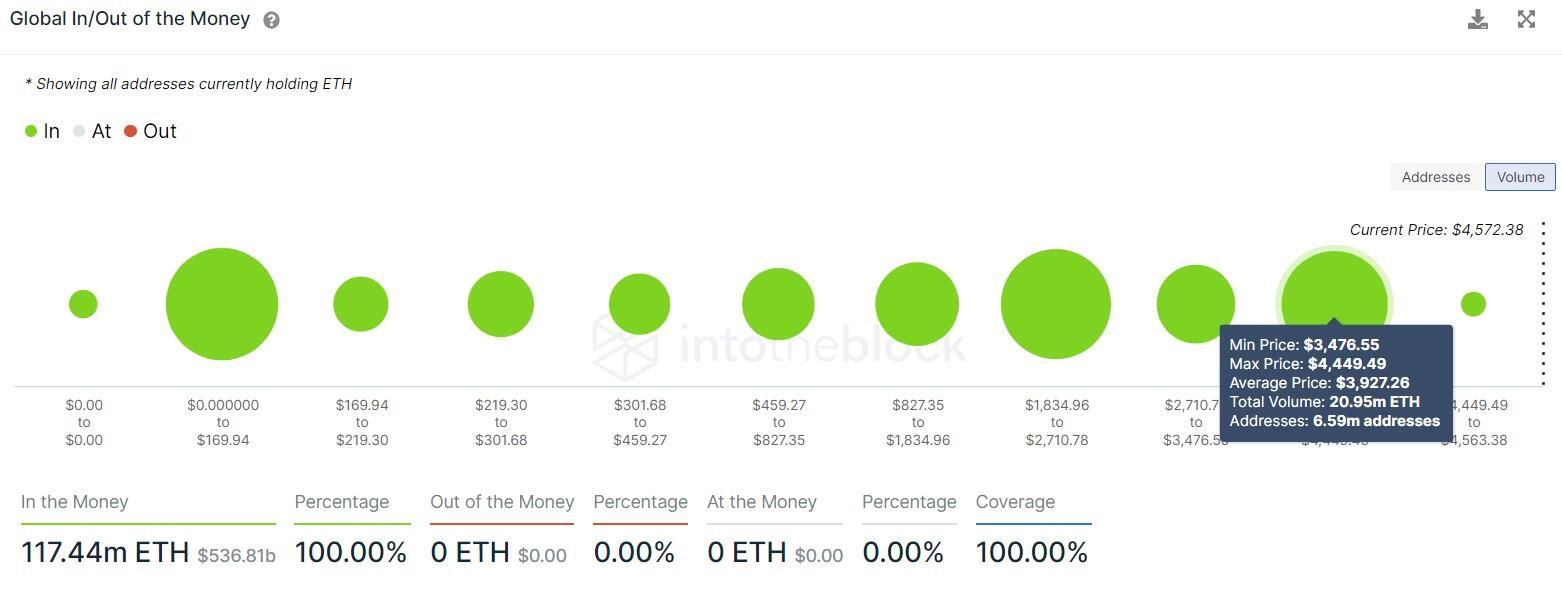
ETH GIOM chart
Market participants should note that this correction is short-term and that the overall outlook for ETH remains bullish. The evidence of this can be seen in the supply on exchanges chart, which shows roughly 1.38 million ETH have left centralized entities. This shortage in ETH suggests that the long-term holders are not concerned about the short-term correction as they remain bullish on ETH.
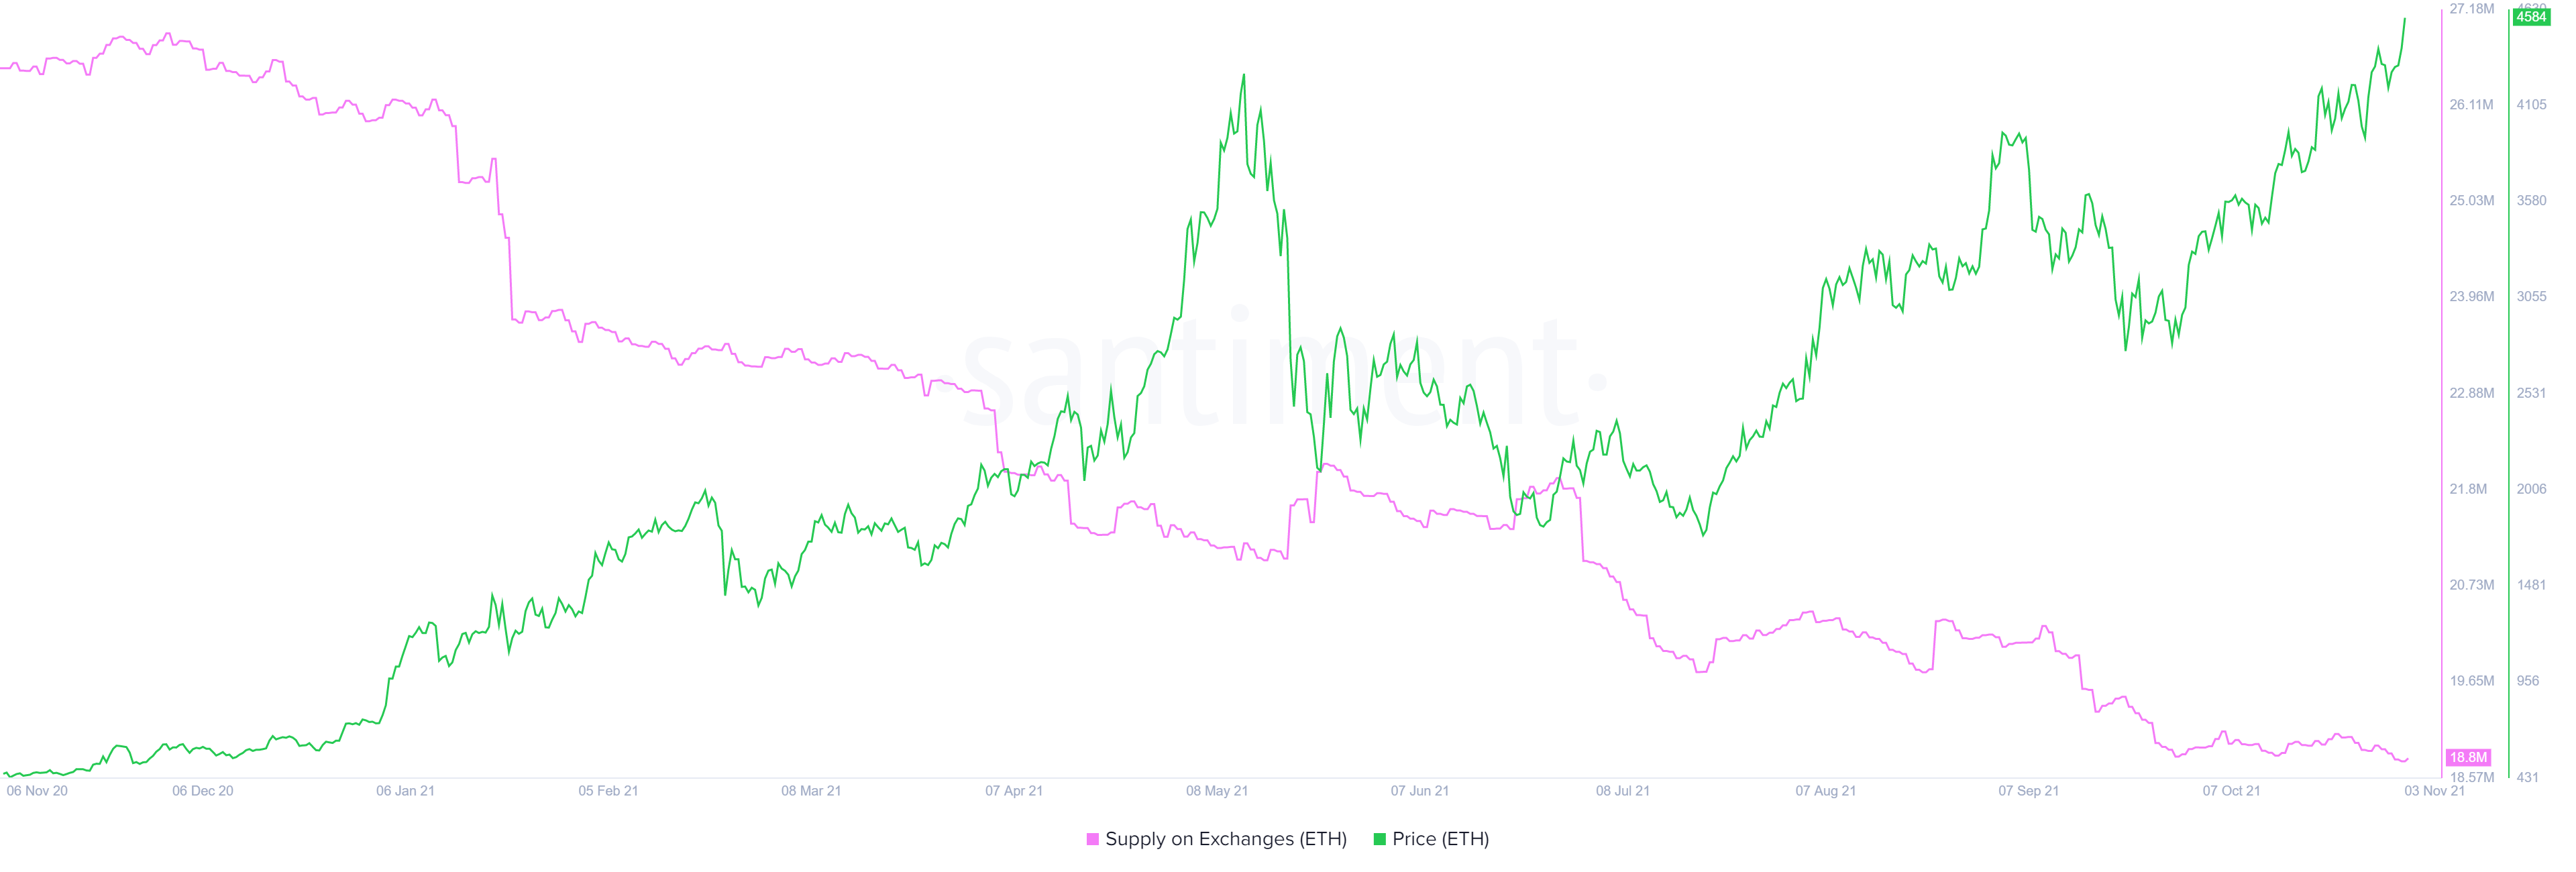
ETH Supply on exchanges.
Fundamentals scream bullish
The London hard fork was successfully implemented on August 5, applying the contentious EIP-1559, which brought the fees burning mechanism for ETH. Since then, Ethereum transactions have burned a total of $3.43 billion worth of Ether (757k ETH). Although Ethereum does not have a hard cap, this makes the network deflationary. The negative supply shock will be a primary reason the token’s market value will propel exponentially in the upcoming bull run.
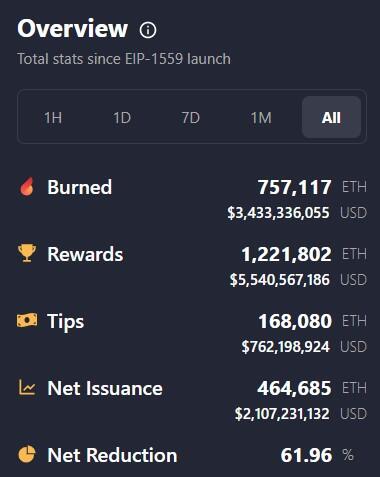
WatchTheBurn chart
Additionally, the number of ETH issued for the past week has fallen behind the number ETH burned. This anomaly is referred to as the “negative issuance” and indicates the increased adoption of the Ethereum network while painting the picture of demand.
#ethereum just had a week of negative issuance, and the triple halving hasn’t even happened yet!
— Lark Davis (@TheCryptoLark) November 1, 2021
While the London hard fork marked an essential step in Ethereum’s transformation, Altair took it one step further. Implemented on October 27, Altair could be the last upgrade to the Beacon chain before ETH moves to Proof-of-Stake (PoS) which allows its clients to build light clients to sync up to the header chain.
Loosely put, Altair prepares the Ethereum network to move entirely to the PoS mechanism. The Merge, which will move Ethereum from Proof-of-Work (PoW) to PoS, is scheduled to be implemented in Q1 or Q2 of 2022.
The official ETH website describes this event as,
Imagine Ethereum is a space ship that isn’t quite ready for an interstellar voyage. With the Beacon Chain the community has built a new engine and a hardened hull. When it’s time, the current ship will dock with this new system, merging into one ship, ready to put in some serious lightyears and take on the universe.
Ethereum price looks bullish from technical, on-chain and fundamental perspectives. Therefore, investors can expect ETH to continue its ascent to new highs. Market participants should consider that a breach below $3,888 could lead to a 12% correction to $3,400. This move does not invalidate the bullish thesis but only delays it. Given enough time and improved market conditions, ETH will make a comeback from this point to reach record highs.
Author

Akash Girimath
FXStreet
Akash Girimath is a Mechanical Engineer interested in the chaos of the financial markets. Trying to make sense of this convoluted yet fascinating space, he switched his engineering job to become a crypto reporter and analyst.


