Ethereum eyes rally against Bitcoin, with ETH price showing hidden bullish divergence

Ethereum’s native token, Ether (ETH), has been declining against its top crypto rival, Bitcoin (BTC), since Sept. 3.
Ether dropped in value against Bitcoin by almost 25% after topping out in September at 0.07955 BTC. As the top altcoin declined, it left behind a trail of lower highs and lower lows, thus forming an ascending channel.
Later, ETH/BTC broke the channel to the upside on Saturday, raising anticipations about a strong extended recovery trend. But a selloff on Sunday and the ongoing session had traders test the channel’s resistance trendline as support.
ETH price charts suggest bullish divergence
The sentiment raised Ether’s possibility to reenter the falling range as shown in the chart below.
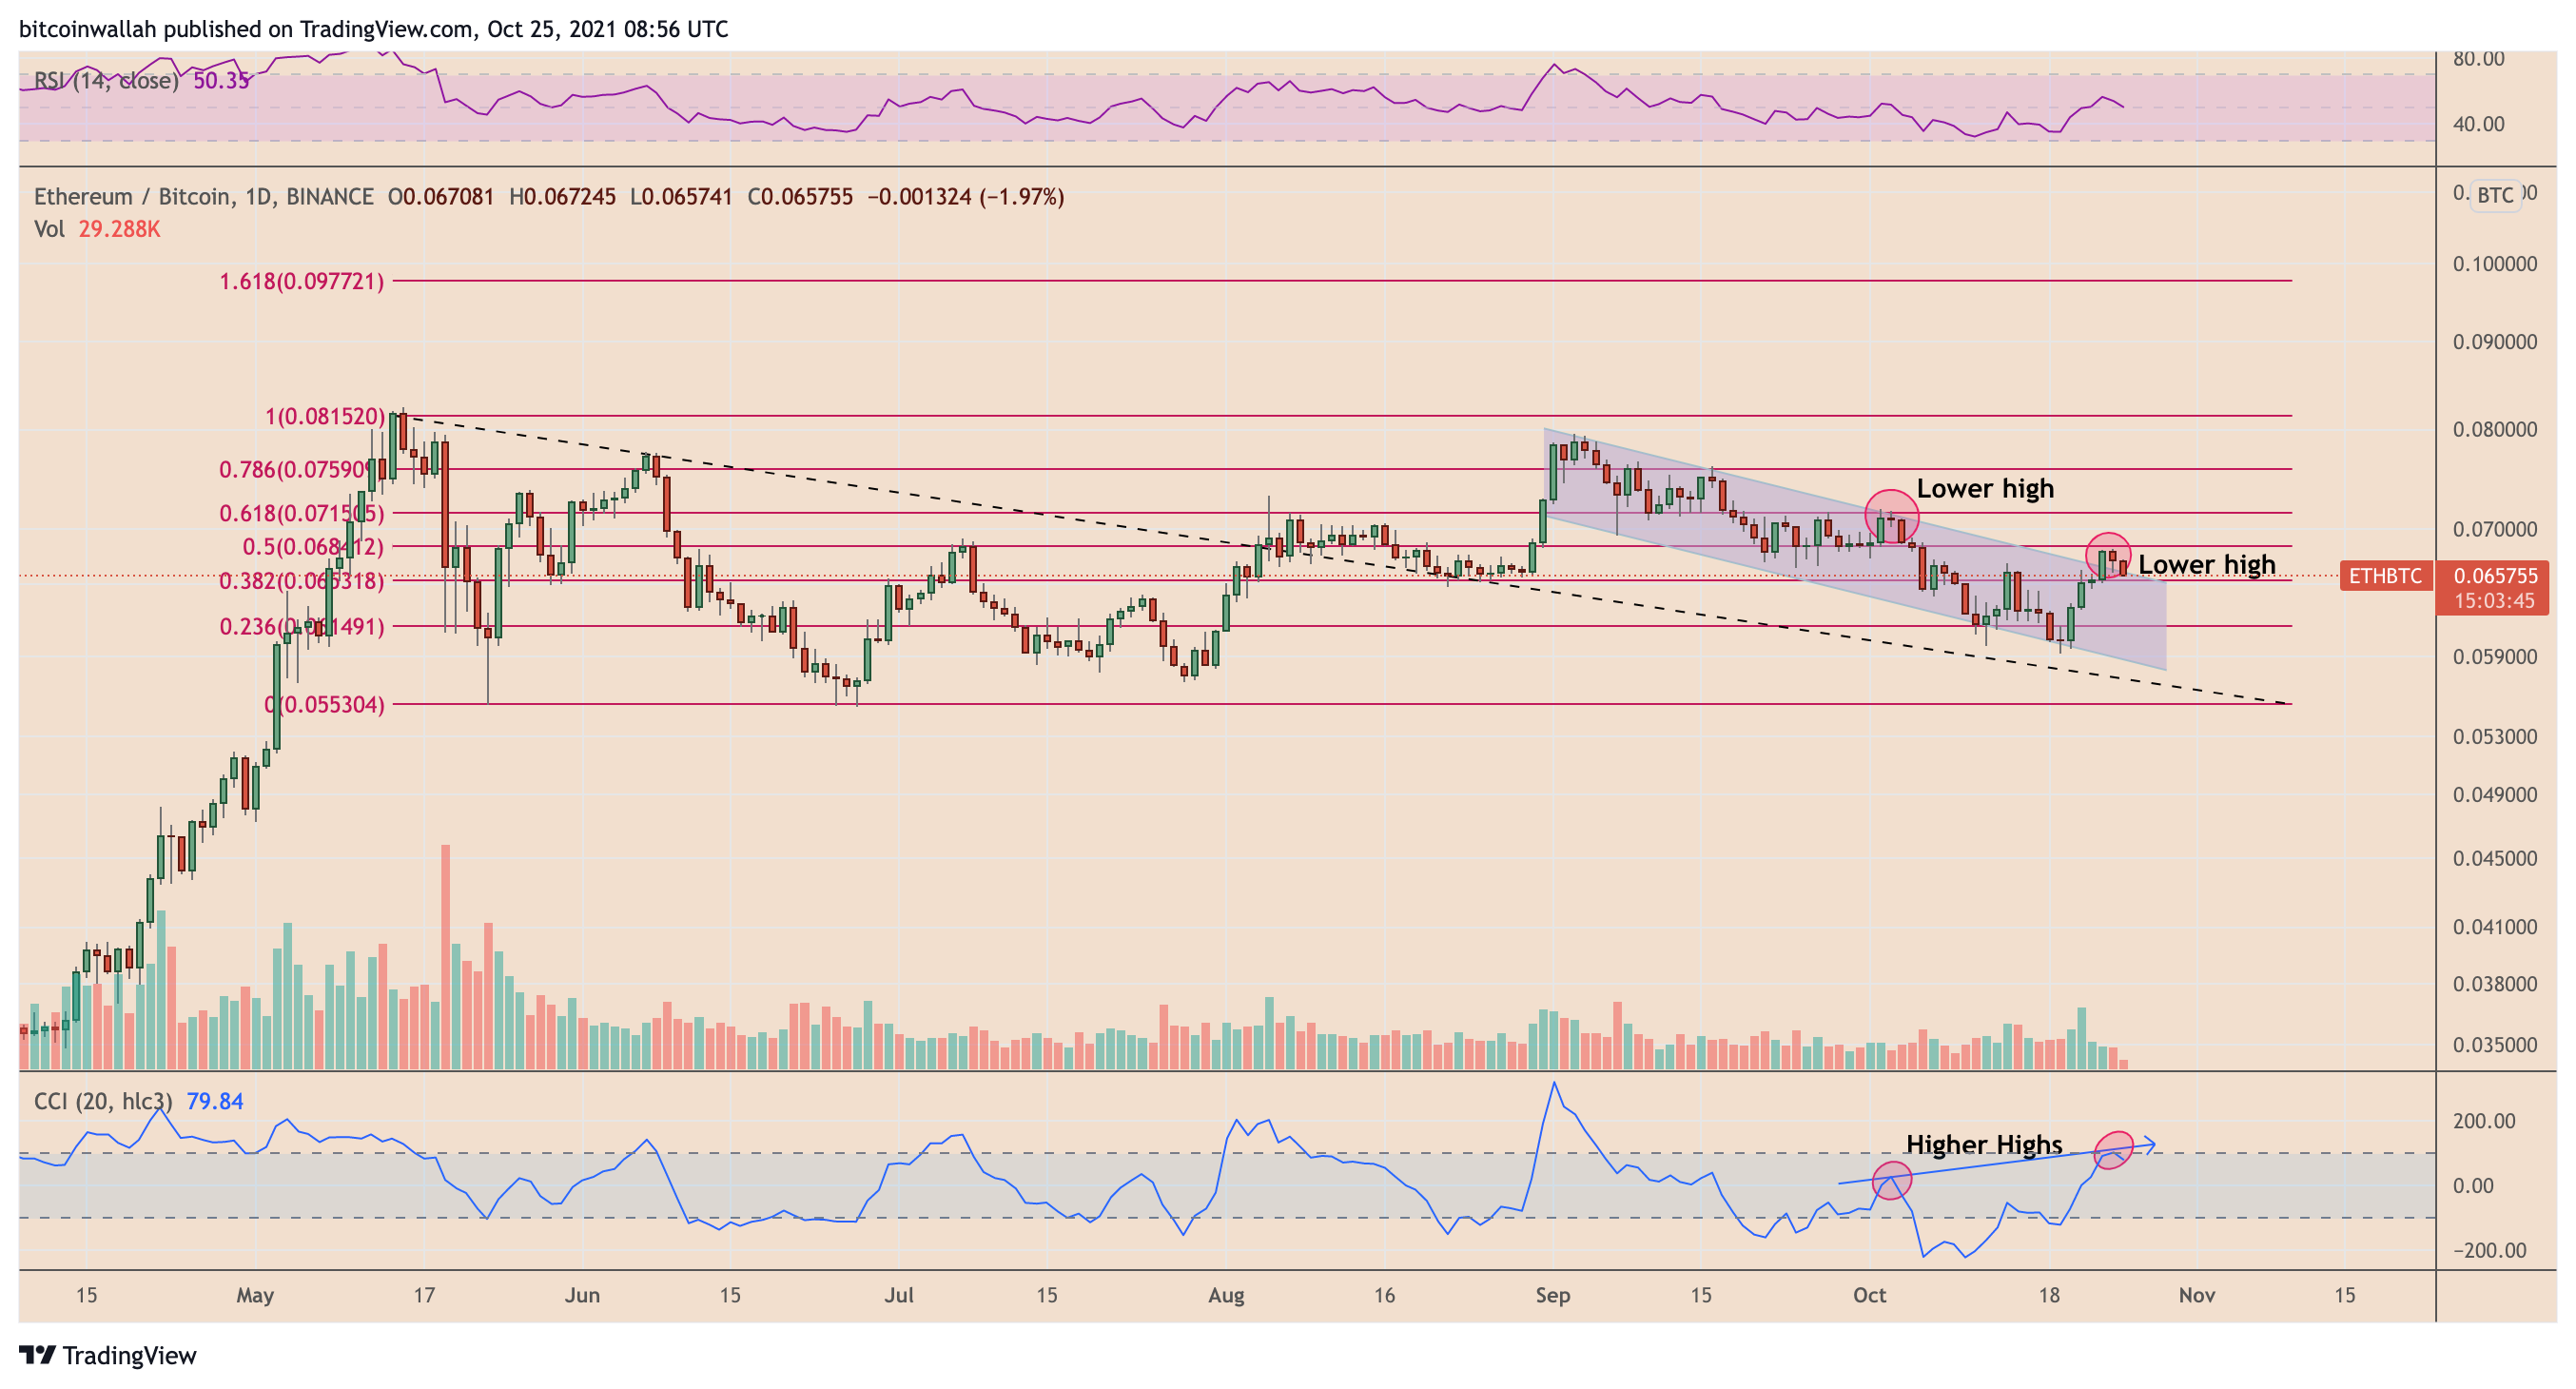
ETH/BTC daily price chart featuring bullish divergence. Source: TradingView
At the same time, the formation of higher highs in ETH/BTC’s daily commodity channel index (CCI) showed hidden divergence against the pair’s downtrend. For the uninitiated, CCI is a momentum oscillator that measures an instrument’s variations from its statistical mean to spot potential reversals.
“A hidden divergence is always an indicator for a possible trend reversal,” noted Stefan Kircher, a Germany-based market strategist, adding that ETH/BTC may rebound in the coming sessions also as the pair’s daily relative strength index (RSI) remains “not overbought.”
Kircher anticipated Ether to hit its monthly pivot point around 0.071586 BTC, almost over 8% of the current levels. The upside target also coincided with the 0.618 Fib line (0.071505 BTC) of the Fibonacci retracement graph in the chart above.
On the flip side, reentering the descending channel range risked sending ETH/BTC to its range support trendline near 0.058238 BTC.
Ether price against the dollar
The bullish ETH/BTC price outlook appeared as Ether held $4,000 as solid support while rebounding over 2.6% Monday. Meanwhile, Bitcoin’s price retraced almost 3.5% after setting up a similarly strong price floor near $60,000.
As a result, ETH/BTC merely looked weaker because Bitcoin rallied strongly against the United States dollar than Ether. Nevertheless, the Ethereum token’s prospects looked bullish, as earlier reported by Cointelegraph, with the aid of an ascending triangle setup shown below.
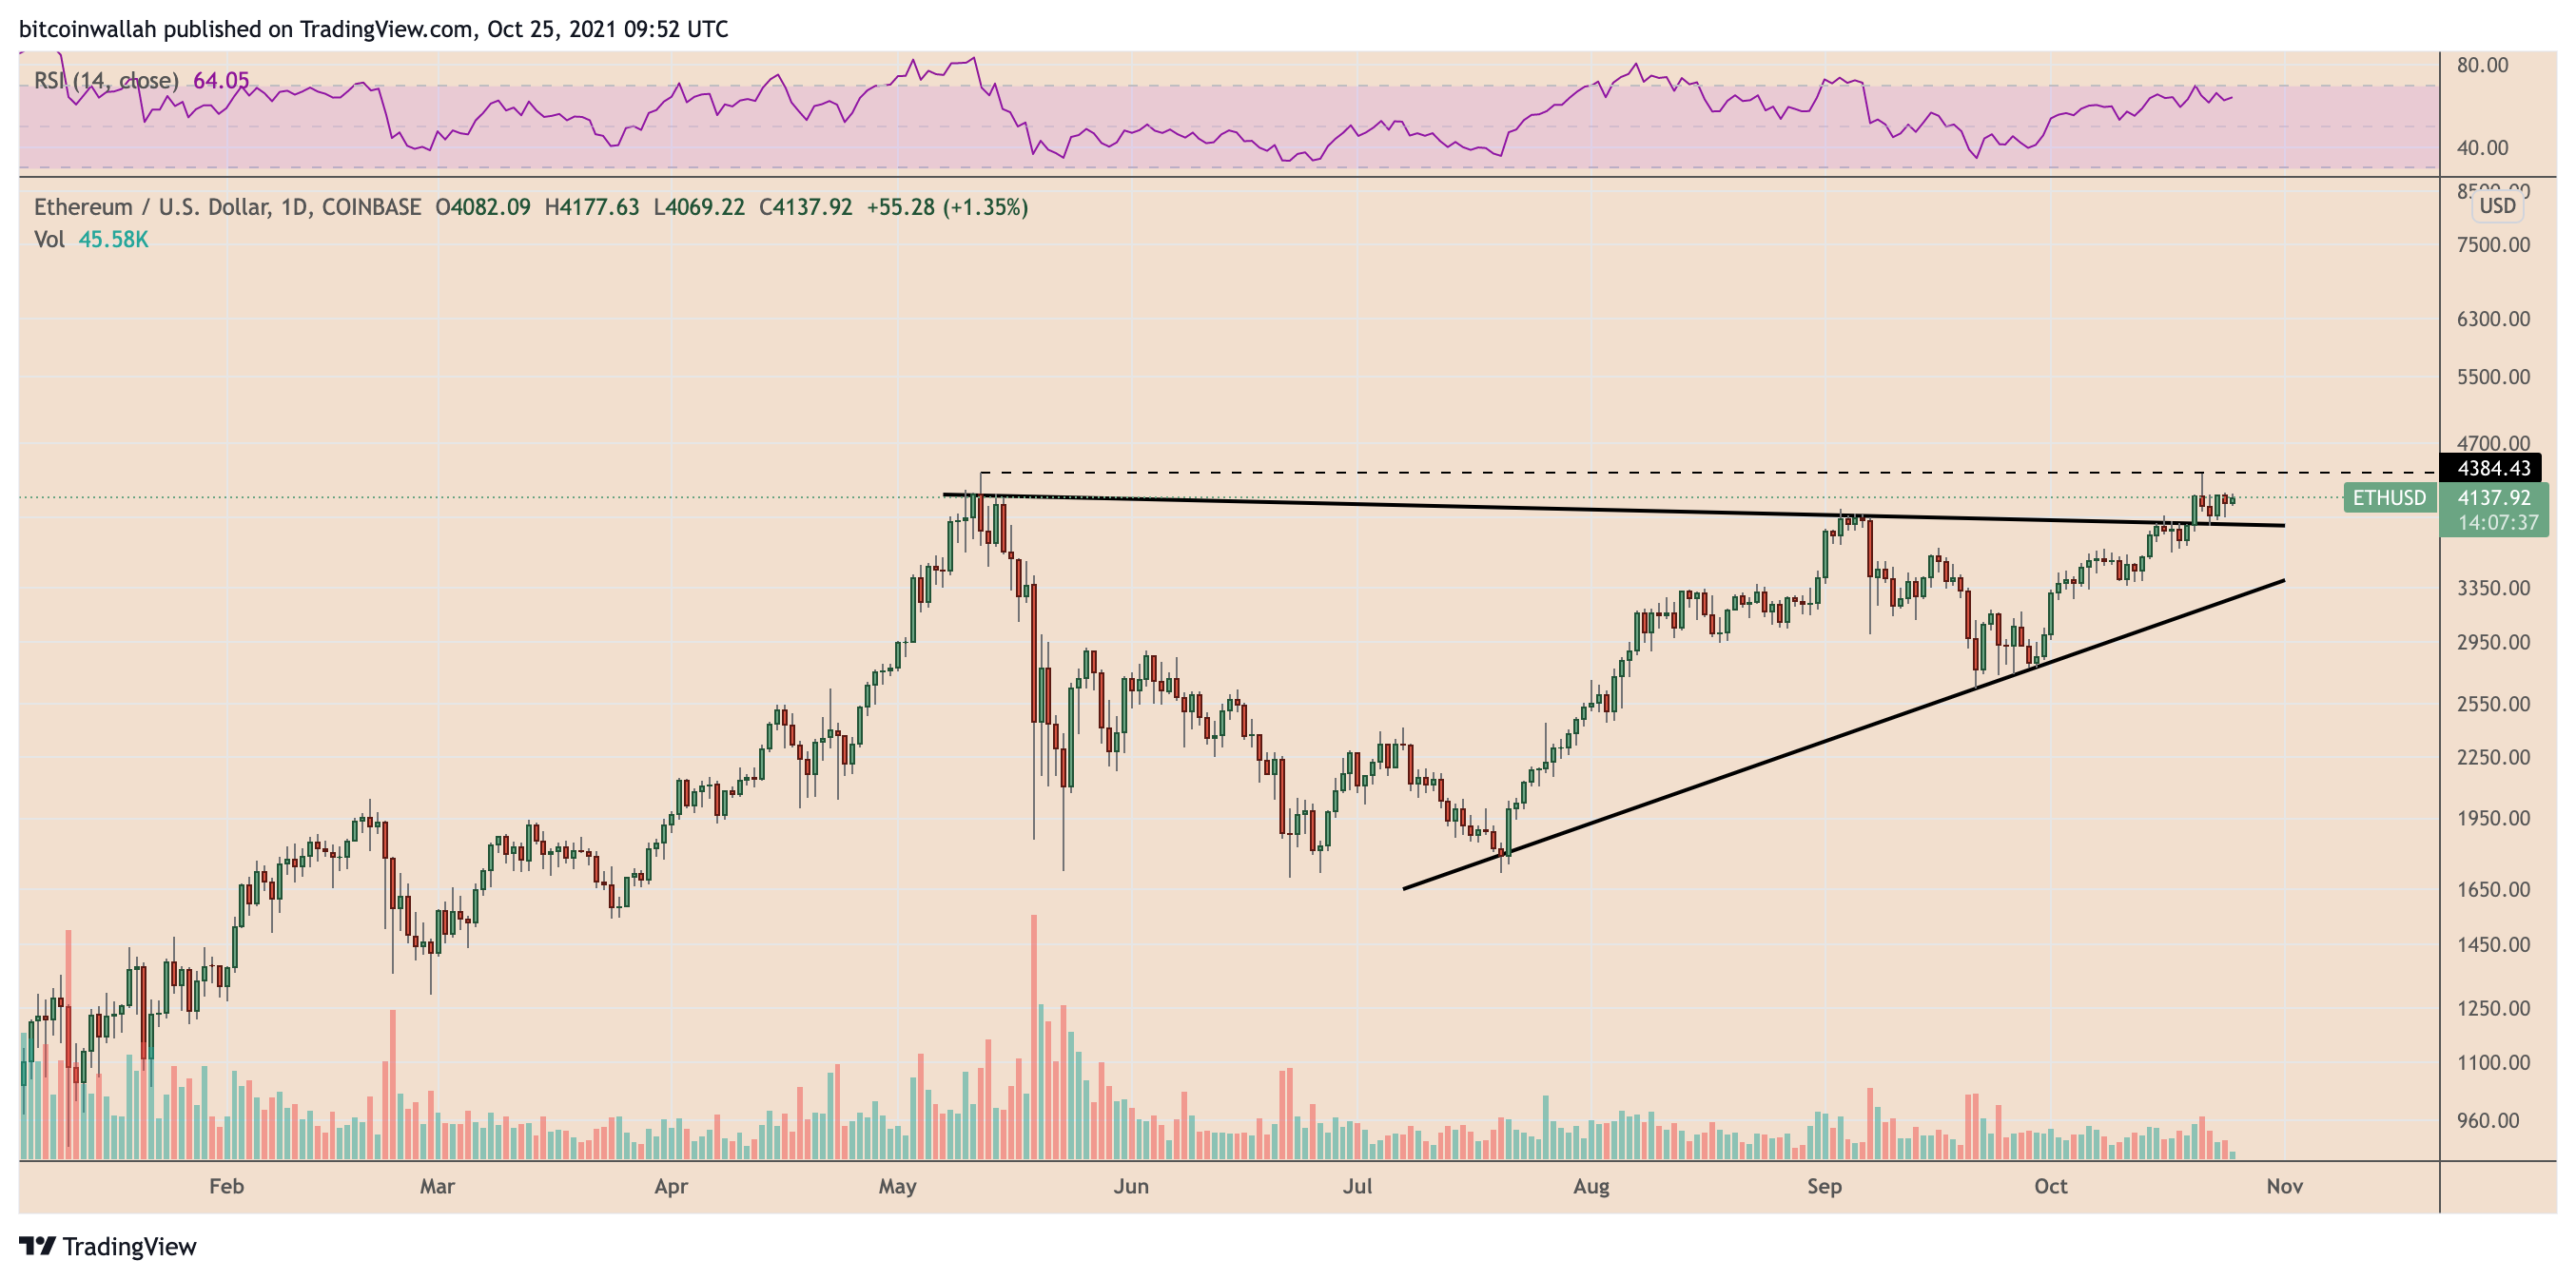
ETH/USD daily price chart featuring ascending triangle setup. Source: TradingView
Ether broke out of the pattern on the daily timeframe but with little trading volume, showing weakness in the price trend.
The cryptocurrency now tests the triangle’s upper trendline as support for bullish confirmation. Should a rebound follow suit, the price could eye new record highs above $4,384, with the triangle setup’s target sitting near $6,500.
ETH supply crunch
Additionally, the supply of Ether tokens has been declining after the Ethereum network’s London hard fork. Namely, the Ethereum Improvement Proposal 1559, which went live with the update, started burning ETH that it previously paid to miners.
Data collected from WatchTheBurn shows that the Ethereum network has destroyed almost $2.25 billion worth of Ether tokens since the London hard fork’s launch.
Additionally, the Ethereum 2.0 deposit contract has attracted more than 8 million ETH, thereby removing them from circulation for at least a year.
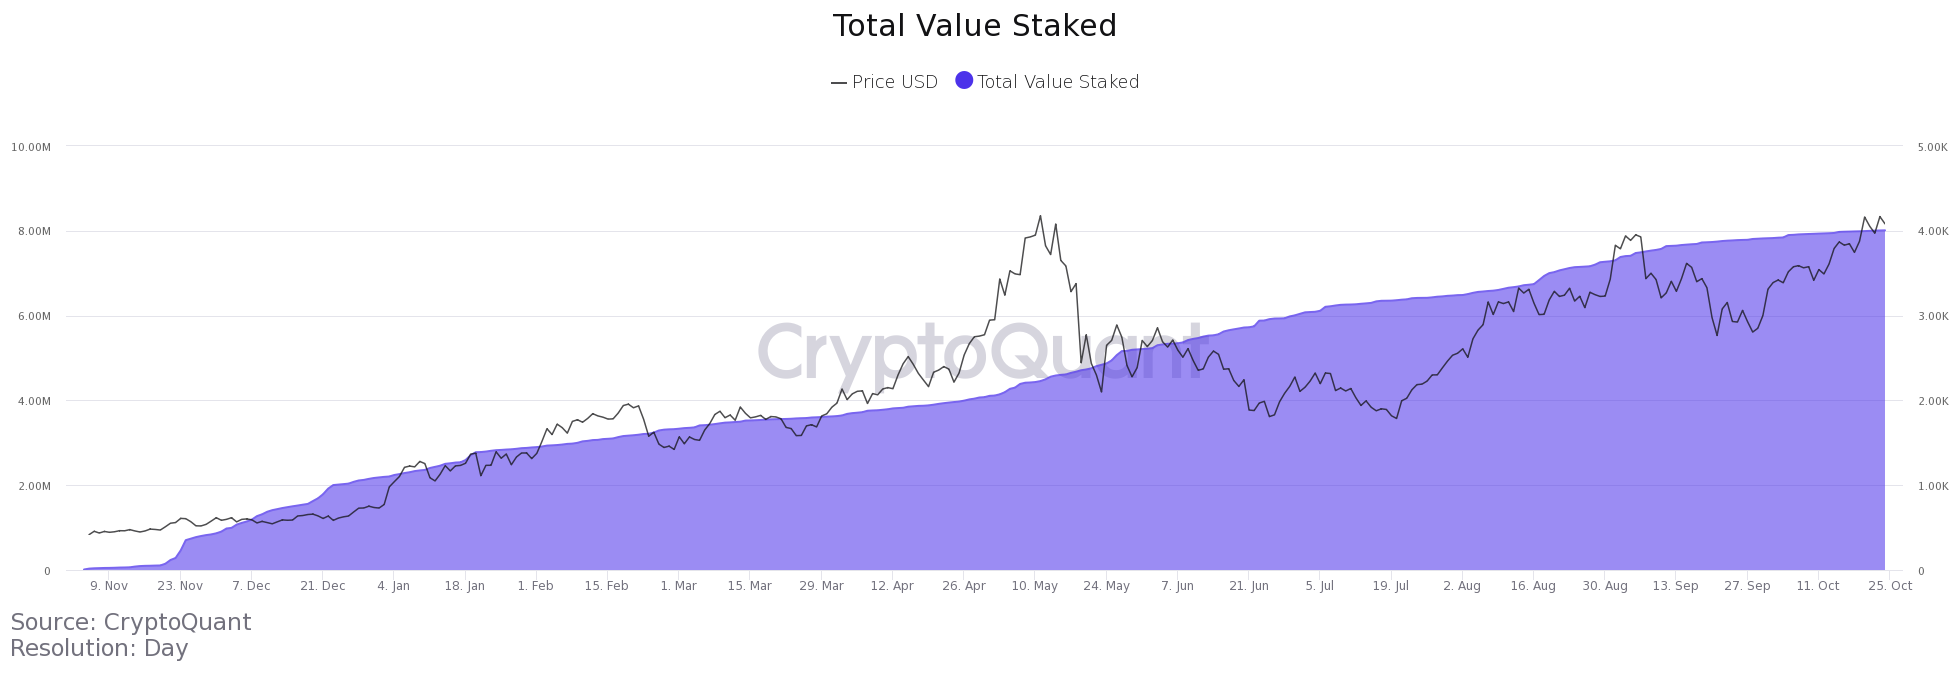
Total value staked in Eth2 smart contract. Source: CryptoQuant
Moreover, regulated funds have increased their Ether holdings from 2.43 million ETH in November 2020 to 4.08 million ETH today, signifying increasing institutional demand.
Author

Cointelegraph Team
Cointelegraph
We are privileged enough to work with the best and brightest in Bitcoin.


