Ethereum (ETH) price analysis: ETH/USD settles below $180.00 amid growing bearish sentiments
- A move below $180.00 has worsened the short-term technical picture.
- The significant support is created on approach to 170.00.

The second-largest cryptocurrency with the current market capitalization of $20.9 billion has broken above critical $190.00 to trade at $194.30 at the time of writing. ETH/USD has gained over 3% on a day-on-day basis and 2.5% since the beginning of the day. Basically, Ethereum is one of the best-performing altcoins out of top-20; however, the shrinking volatility implies that the further upside may be limited.
Ethereum’s long-term technical picture
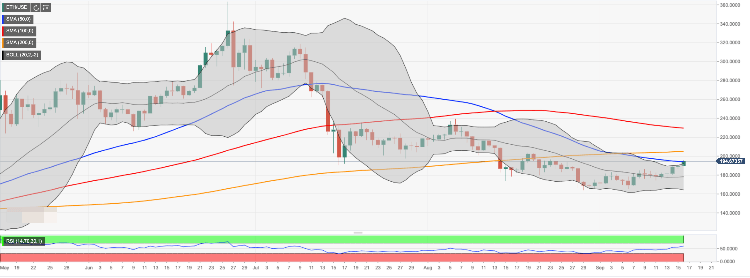
Looking technically, ETH/USD is trying to clear $194.00 resistance created by SMA50 (Simple Moving Average) on a daily chart. Once it is cleared, the upside is likely to gain traction with the next focus on psychological $200.00. This area may slow down the recovery as it contains strong stop orders on speculative short positions. However, a sustainable move above this barrier will open up the way to $205/00 (SMA200 daily) and $222.00 (SMA200 weekly chart).
On the downside, strong support awaits ETH on approach to $180.00 It is created by SMA500 weekly and the lower line of one-day hour Bollinger Band. It it is broken, the sell-off may gain traction and push the price towards $165.00 (the upper line of one-day Bollinger Band).
Considering the upward-looking RSI (Relative Strength Index) on a daily chart, the bullish scenario have a higher probability.
ETH/USD, daily chart

Author

Tanya Abrosimova
Independent Analyst


