Ethereum ETF race intensifies with ARK/21Shares and VanEck’s revised filings
- VanEck submitted a revised S-1A filing and ARK/21Shares filed a new 19b-4 for their Spot Ethereum ETFs.
- Spot Ethereum ETF is likely to be approved by the US SEC by May 2024.
- Ethereum price hit its 2024 peak of $2,867.65 on Saturday, inching closer to its $3,000 target.

Securities and Exchange Commission’s (SEC) approval of the Spot Bitcoin ETF ushered in large volume of institutional capital into the asset and fueled gains in BTC, pushing it to a new two-year high.
Market participants expect a similar occurrence in Ethereum and the anticipation surrounding Spot Ethereum ETF approval by the US financial regulator has increased.
Also read: Worldcoin breaks into massive rally, climbs 25% overnight as OpenAI unveils Sora
Ethereum ETF applicants amend their filings
Spot Ethereum ETF applicants VanEck and ARK/21Shares have amended their filings for the exchange traded product. Bloomberg ETF analyst James Seyffart’s recent tweet on X reveals that VanEck submitted a revised S-1A filing for its Spot Ethereum ETF, and ARK/21Shares also submitted a new 19b-4 filing and a series of new analyzes for its Spot Ethereum ETF.
Just had @vaneck_us submit an updated S-1A for their spot #Ethereum ETF filing. pic.twitter.com/eHn3iCYuQu
— James Seyffart (@JSeyff) February 16, 2024
A Bloomberg report from January 30 states that Standard Chartered is positive that the US SEC will allow exchange-traded funds to hold the cryptocurrency Ethereum, as early as May 2024. The bank shared its prediction in a research report on Tuesday. Standard Chartered believes that the asset managers will be the first to come up against the final deadline.
Experts expect Ethereum price to hit a peak of $4,000 by the expected approval date.
Ethereum price rally to $3,000 likely in the coming weeks
Ethereum price is currently in an upward trend. ETH price climbed past key resistances at the $2,000, $2,500 and $2,687. Ethereum is exchanging hands at $2,783 on Saturday. Ethereum price hit its 2024 peak of $2,867 on Thursday. The altcoin is likely to rally towards its target of $3,000 in the coming weeks.
The green bars on the Awesome Oscillator (AO) and the Moving Average Convergence/ Divergence (MACD) suggest that the uptrend is in place and there is positive momentum.
Ethereum price is likely to continue rallying higher.
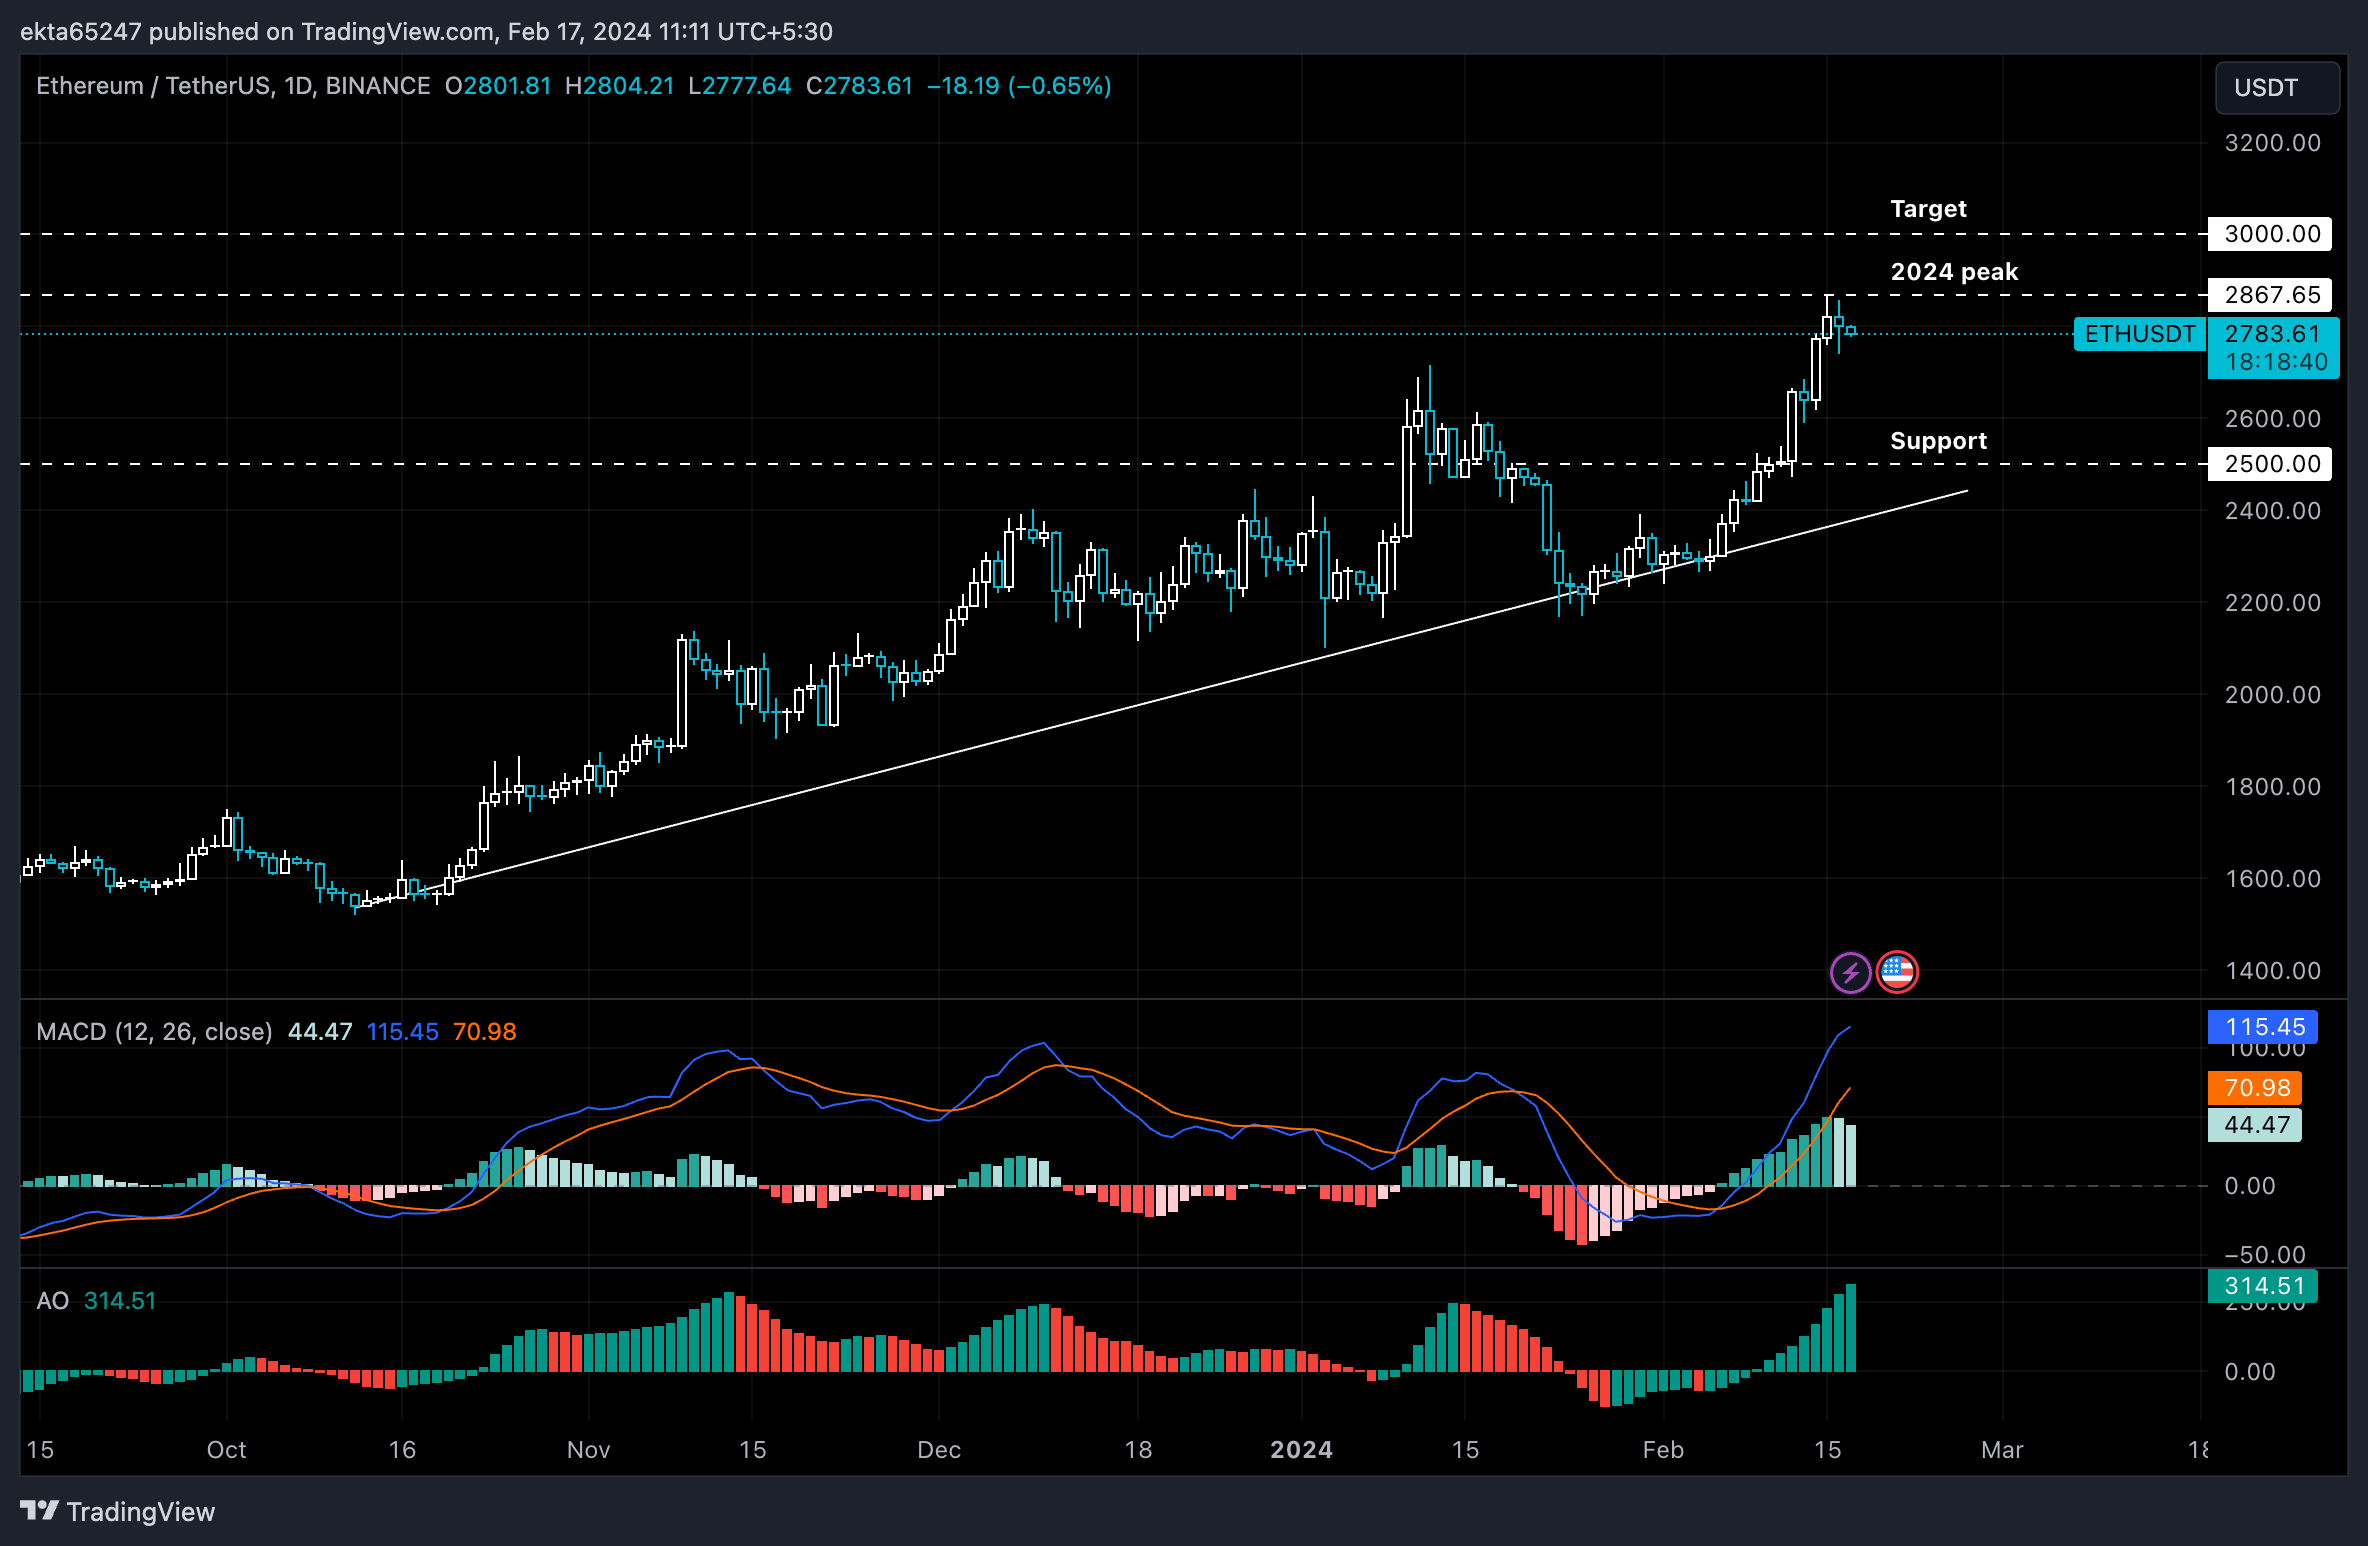
ETH/USDT 1-day chart
If Ethereum price sees a daily candlestick close below the $2,687 level, a steep decline to support at $2,500 is likely.
Author

Ekta Mourya
FXStreet
Ekta Mourya has extensive experience in fundamental and on-chain analysis, particularly focused on impact of macroeconomics and central bank policies on cryptocurrencies.



