Ethereum dips below $2,300 following August NFP data, JP Morgan weighs in on ETH ETF performance
- Ethereum dives nearly 6% after August NFP miss.
- Based on the AUM ratio to market cap, Ethereum ETFs have performed more or less in line with Bitcoin ETFs one month after launch.
- ETH needs to bounce around $2,100 to maintain the bull market thesis.

Ethereum (ETH) is down nearly 6% on Friday after the US released its worrisome August Nonfarm Payrolls (NFP) data. Meanwhile, JP Morgan analysts released a report stating that ETH ETFs have performed closely to Bitcoin ETFs on a one-month, post-launch basis.
Daily digest market movers: Ethereum dips, JP Morgan shares take on ETH ETFs
Ethereum, along with much of the entire crypto market, has posted losses for three consecutive days following the further plunge on Friday. The decline came after the release of the US Nonfarm Payrolls (NFP) data from August, which revealed an in-line Unemployment Rate of 4.2% — down from 4.3% in July — and the US economy adding 142,000 jobs.
The US jobs print worried US markets since Wall Street was expecting at least 160,000 new jobs and this print follows July’s hiring slowdown. Alongside US equity prices, Ethereum dipped after showing signs of recovery during the European trading session.
A similar trend is visible across Ethereum exchange-traded funds (ETF), which posted negative flows for a third consecutive day, per Farside Investors data. The products posted net outflows of $0.2 million, their lowest outflow since launch.
The weak performance of ETH ETFs is visible when comparing days of inflows versus outflows. Notably, ETH ETFs have only seen nine days of inflows against 23 days of outflows and one day of zero flow since its launch. Its cumulative flows are at $0.56 billion net outflows.
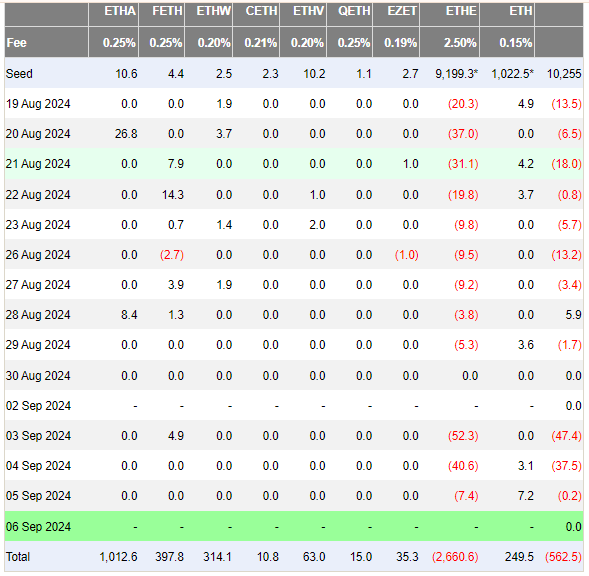
ETH ETF Flows
While several market participants believe that ETH ETFs have underperformed, JP Morgan analysts stated that they are performing more or less in line with Bitcoin ETFs. When compared on a one-month, post-launch juncture based on assets under management (AUM) as a percentage of market capitalization, the analysts stated that the two products are closely on par.
"At the end of August, we estimate the group of ETH ETFs' gross AUM (including Grayscale's ETHE) made up ~2.3% of Ethereum's overall market cap," said JP Morgan analysts. "When comparing to the 29th day of trading for the spot Bitcoin ETFs (February 22, 2024), total BTC ETF AUM (including Grayscale's GBTC) made up 3.0% of Bitcoin's total market cap at the time," they added.
ETH ETFs’ AUM as a Percentage of Token Market Cap In-line with Bitcoin Equivalent at its Respective ~1mo Post-Launch Juncture
— matthew sigel, recovering CFA (@matthew_sigel) September 6, 2024
"When comparing the gross AUM (including legacy Grayscale products that converted into ETFs upon launch) as a percentage of the respective token’s market…
Meanwhile, asset manager VanEck announced in a press release on Friday that it will close and liquidate its Ethereum futures ETF (EFUT) after the market closes on September 16. While the company stated several potential reasons for the decision, crypto community members noted that it may be because Van Eck has already launched a spot ETH ETF. The company also closed its Bitcoin Futures ETF following the approval of spot Bitcoin ETF, noted WuBlockchain.
ETH technical analysis: Ethereum needs to bounce off key support to keep bull market intact
Ethereum is trading around $2,220 on Friday, down 6% on the day. In the past 24 hours, ETH has seen $35.08 million in liquidations, with long and short liquidations accounting for $26.67 million and $8.42 million, respectively.
On the daily chart, ETH has fallen below a descending trendline within a symmetry triangle that suggests its price could decline toward $2,100 in the coming weeks before staging a rally. ETH posted similar declines from August to November 2022 and from July to October 2023 before staging a rally.
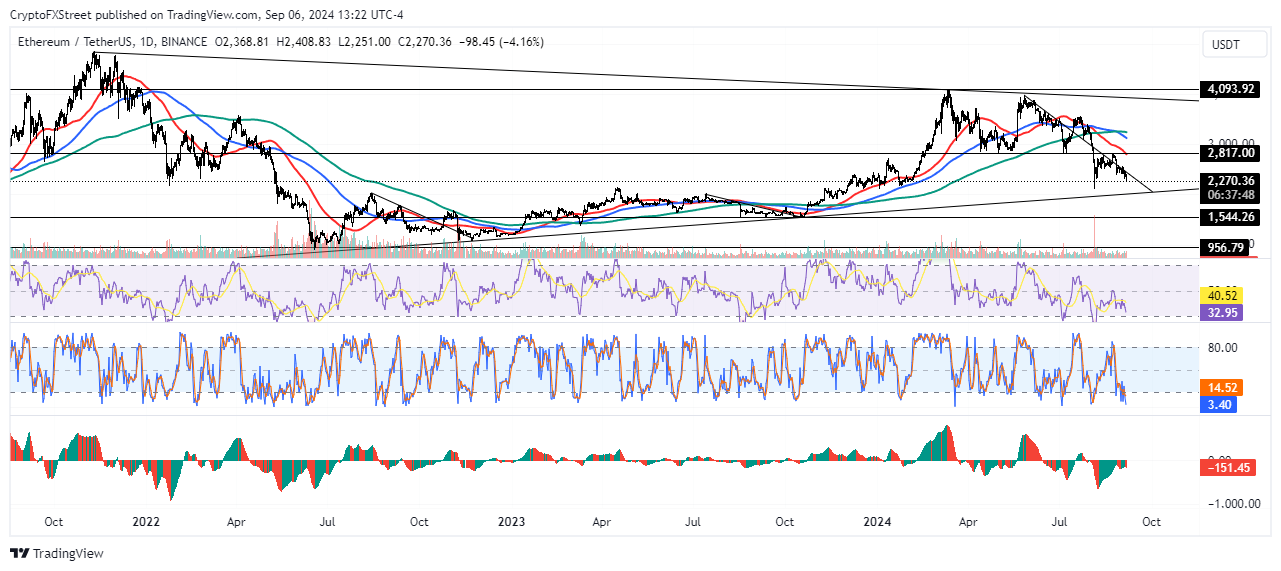
ETH/USDT Daily chart
If history repeats, ETH will bounce around the $2,100 level before staging a rally to tackle the $2,817 resistance. If it successfully moves above this resistance, ETH could rally further to tackle its yearly high resistance around $4,093.
A daily candlestick close below the lower ascending trendline of the symmetry triangle could send ETH toward the support around $1,540.
The Relative Strength Index (RSI) is at 33 and trending downward toward the oversold region. The Stochastic Oscillator's %K and %D lines show a similar picture, hovering in and around the oversold region.
The Awesome Oscillator posted consecutive red bars below the zero line, indicating dominant bearish momentum.
Ethereum FAQs
Ethereum is a decentralized open-source blockchain with smart contracts functionality. Serving as the basal network for the Ether (ETH) cryptocurrency, it is the second largest crypto and largest altcoin by market capitalization. The Ethereum network is tailored for scalability, programmability, security, and decentralization, attributes that make it popular among developers.
Ethereum uses decentralized blockchain technology, where developers can build and deploy applications that are independent of the central authority. To make this easier, the network has a programming language in place, which helps users create self-executing smart contracts. A smart contract is basically a code that can be verified and allows inter-user transactions.
Staking is a process where investors grow their portfolios by locking their assets for a specified duration instead of selling them. It is used by most blockchains, especially the ones that employ Proof-of-Stake (PoS) mechanism, with users earning rewards as an incentive for committing their tokens. For most long-term cryptocurrency holders, staking is a strategy to make passive income from your assets, putting them to work in exchange for reward generation.
Ethereum transitioned from a Proof-of-Work (PoW) to a Proof-of-Stake (PoS) mechanism in an event christened “The Merge.” The transformation came as the network wanted to achieve more security, cut down on energy consumption by 99.95%, and execute new scaling solutions with a possible threshold of 100,000 transactions per second. With PoS, there are less entry barriers for miners considering the reduced energy demands.
Author

Michael Ebiekutan
FXStreet
With a deep passion for web3 technology, he's collaborated with industry-leading brands like Mara, ITAK, and FXStreet in delivering groundbreaking reports on web3's transformative potential across diverse sectors. In addition to


