Ethereum Classic price dips become attractive
- Ethereum Classic price is at make-or-break juncture with break above the 50-day SMA reaching $50 and $80, respectively.
- A bullish MACD and support provided by the 100-day SMA uphold ETC’s long-term bullish stance.
- Ethereum Classic price is not entirely out of danger, especially if it gets rejected from the 50-day SMA.

Ethereum Classic price performed exceptionally well over the last 30 days, netting returns of up to 153%. The chief reason for this rally has everything to do with Ethereum’s much-awaited switch from a miner-oriented protocol called proof-of-work (PoW) to an environmentally-friendly consensus algorithm known as proof-of-stake (PoS).
What does the Ethereum merge mean for Ethereum Classic price?
As previously covered, Ethereum miners will find themselves at crossroads when the merge takes place In September. They will have two viable options; to sell their equipment or migrate to another similar blockchain Like Ethereum Classic and continue their mining operations.
Miners are already showing interest in Ethereum Classic with Antpool, one of the biggest mining pools, pledging $10 million in support of its ecosystem. The co-founder of Ethereum, Vitalik Buterin, affirmed that miners were okay to switch to the original Ethereum protocol.
Outwardly, this may seem optimistic for Ethereum Classic price, but the question among investors is whether the uptrend has the potential to continue. It is essential to factor in a long-standing crypto narrative of buying the rumor and selling the news. For example, Bitcoin price briefly rallied to its all-time high in November when the Security and Exchange Commission (SEC) approved the first BTC futures exchange-traded fund (ETF). However, investors sold the news as Bitcoin price tumbled, leaving little to be desired in 2022.
Investors and analysts fear the same thing may happen to Ethereum Classic. However, our analysis shows that ETC is unlikely to give up much of the accrued gains. This insight does not rule out minor dips south of the resistance at $40.
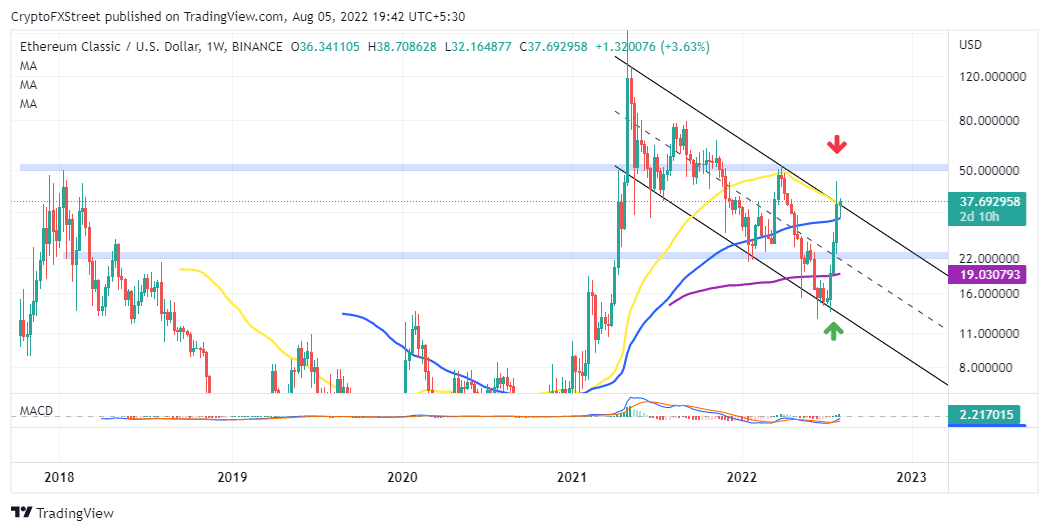
ETH/USD weekly chart
A thorough analysis of the weekly chart places Ethereum Classic price on top of a robust anchor provided by the 100-day Simple Moving Average (SMA). At the same time, the Moving Average Convergence Divergence (MACD) vividly spots a buy signal.
A defining moment awaits Ethereum Classic price at the 50-day SMA, which coincides with the descending parallel channel’s upper boundary. If Ethereum Classic price confirms a real break above this zone, investors may acclimatize to higher highs at $50 and $80, respectively.
However, if the impediment at the 50-day SMA holds, it would be prudent to consider a downside scope of $22. Remember, crypto markets mainly run on emotions. Hence, continued signs of weakness would see Ethereum Classic price seek reprieve at $14.50 – the channel’s lower boundary.
Author

John Isige
FXStreet
John Isige is a seasoned cryptocurrency journalist and markets analyst committed to delivering high-quality, actionable insights tailored to traders, investors, and crypto enthusiasts. He enjoys deep dives into emerging Web3 tren


![Hyperliquid representatives, Trade[XYZ] meet SEC Crypto Task Force to discuss digital asset regulation](https://editorial.fxsstatic.com/images/i/Hyperliquid_Bull.png)
