Ethereum Classic bulls in panic as ETC stands ready to shed 13%
- Ethereum Classic price is caught in a downward trend for seven consecutive days.
- A break lower looks to be inevitable for price action.
- Support might not be strong enough at $52.44 and open an additional 8% of correction.

Ethereum Classic (ETC) price was moving to the downside with sellers defending a red descending trend line with already three confirmed failed attempts from buyers to break the trend. Sellers are now adding additional support for their short positions at the 55-day Simple Moving Average (SMA).
Ethereum Classic price ready to retrace
The red descending trend line in Ethereum Classic originates from September 8 and has been dictating price action ever since. With lower highs and lower lows, sellers look to be mainly in the driving seat. That does not mean that buyers are just standing on the sideline watching though. A few attempts have emerged from buyers in ETC to break the red descending trend line to the upside. Those attempts failed each time, resulting in a massive inflow of shorters, followed by a significant correction the next day. The correction yesterday touched $52.44. A critical level going back to July 27 with several tests on both the upside and downside in ETC.
Ethereum Classic buyers will want to wait now and might not be eager to step in at $52.44. The problem is that there is only one reason to go long, with the level an indication of previous importance. That looks relatively weak for being the main reason to get in here.
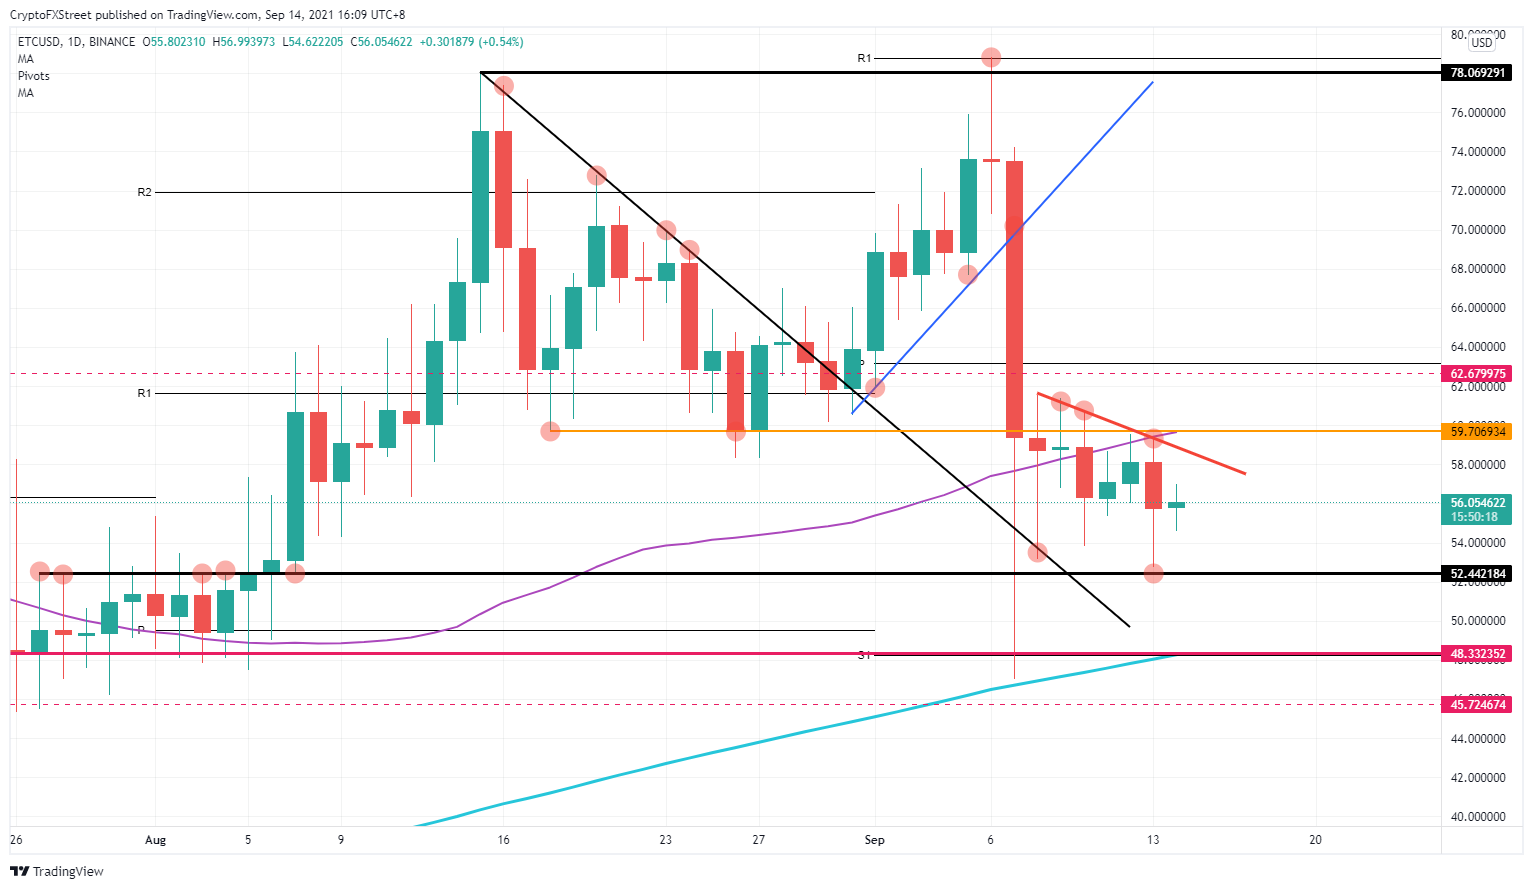
ETC/USD daily chart
Ethereum Classic sellers will want to test $52.44 and drive prices lower toward an interesting level to book profit. That level in ETC offers itself at $48.33. Both buyers and sellers have three reasons here to react. There is historical importance from April 16, but it is also the monthly S1 support level. Although broken through, it was able to stop the violent falling knife from September 7. The last element is the 200-day Simple Moving Average (SMA) that will act as additional support and an incentive for buyers to step in.
In case sentiment shifts toward more risk, ETC sees more buy-action in its price, expect a break higher above the red descending trend line and subsequently a retest of $63 with the dotted red level and the monthly pivot as two main factors to book some short-term profit on those longs.
Author

Filip Lagaart
FXStreet
Filip Lagaart is a former sales/trader with over 15 years of financial markets expertise under its belt.




