Enjin Coin price continues drift lower, while broader cryptocurrency weakness silences ENJ buyers
- Enjin coin price continues to oscillate in a broadening descending wedge pattern.
- Yesterday’s hammer candlestick pattern fails to be validated today.
- Number of hodlers (1Y+) addresses increases over the last 30 days.

Enjin Coin price drift has been marked by two reversals from below the wedge’s lower trend line that failed to transform into a sustainable rebound. ENJ will be weighed down by the downside bias in cryptocurrencies for the time being, but there are no apparent signs of panic selling.
Enjin Coin price decline is not due to a deterioration in on-chain data
Over the last three months, hodlers addresses have increased from 22.1k to 31.2k with an average time held of 2.3 years. One of the signs that committed investors have not sought to capture gains or been shaken out by the sell-off over the last couple of weeks. They are more interested in the longer-term story of ENJ.
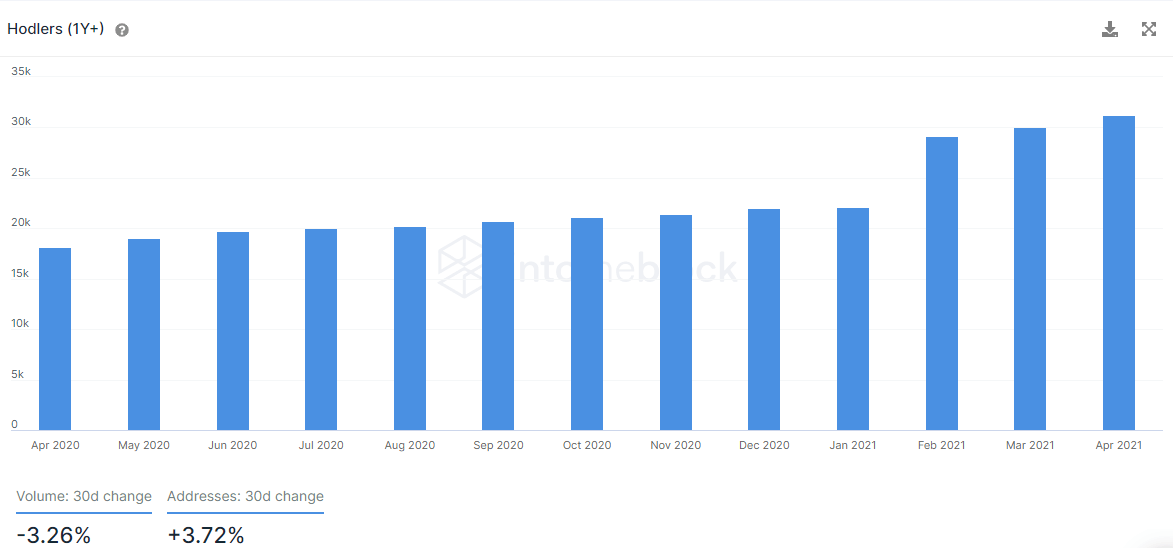
ENJ number of hodlers addresses
Like the bullish hodlers data, the number of ENJ tokens inside exchanges, representing how many speculators are looking to sell, has declined rather than increased during the sell-off. One of the main contributors to the slow drift on well-below average volume.
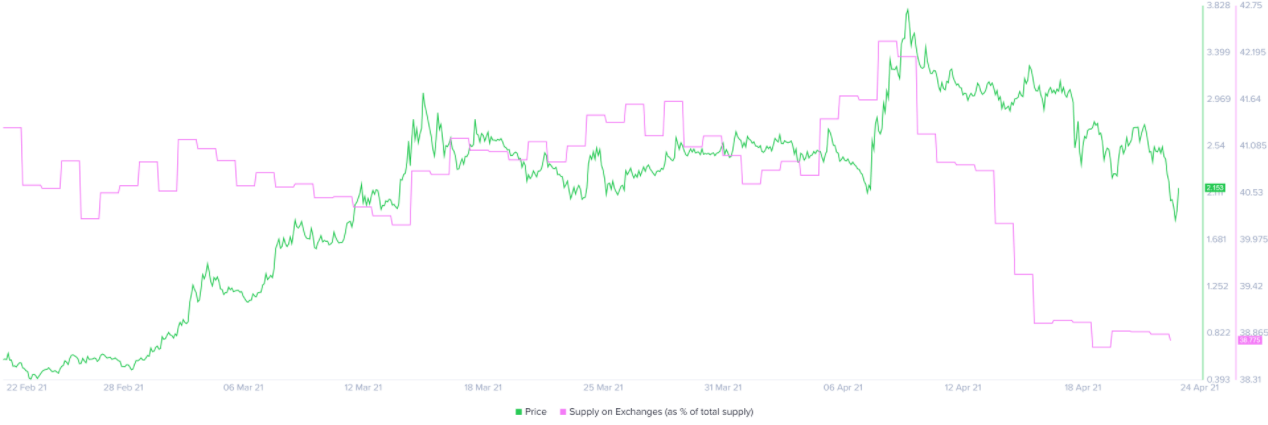
ENJ exchange supply numbers
Enjin Coin price has failed to rise above yesterday’s bullish hammer pattern, raising the odds of another touch of the wedge’s lower trend line at $1.90. A daily close below the trend line would signal a final washout for the token and a test of at least the 61.8% Fibonacci retracement of the 2021 rally at $1.61, and maybe the 100-day simple moving average (SMA) at $1.47.
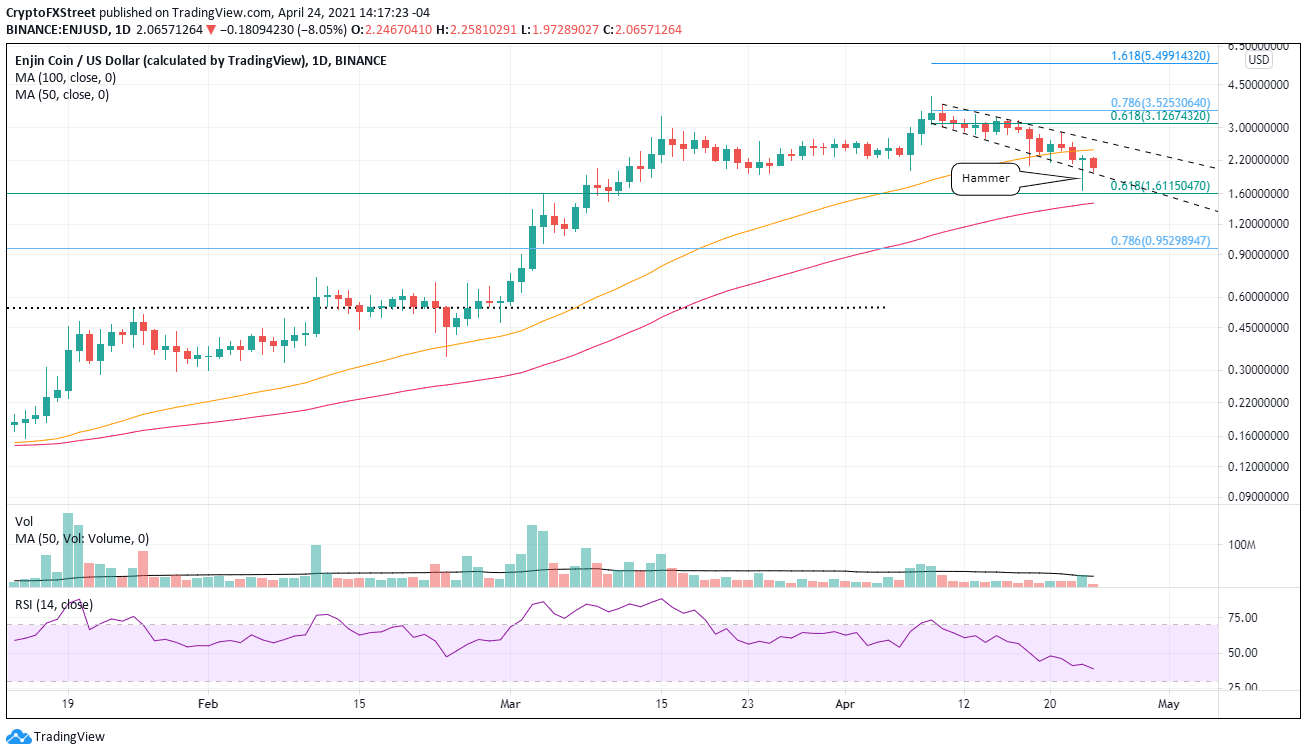
ENJ/USD daily chart
Now, a renewal of commitment and emotion could strike ENJ and lift the price higher. The altcoin will discover initial resistance at the 50-day SMA at $2.43, followed by the wedge’s upper trend line at $2.63. A daily close above the trend line should usher in a test of the 61.8% retracement of the April decline at $3.13 and the March 15 high at $3.33.
A measured move would lift ENJ to the all-time high at $4.03.
Author

Sheldon McIntyre, CMT
Independent Analyst
Sheldon has 24 years of investment experience holding various positions in companies based in the United States and Chile. His core competencies include BRIC and G-10 equity markets, swing and position trading and technical analysis.


