Enjin Coin price shakes off selling pressure, primed for a 25% rally
- Enjin Coin price is quietly forming a head-and-shoulders bottom pattern.
- IOMAP data shows notable resistance along the potential neckline.
- ENJ has grown into a leading ecosystem of integrated digital products, for trading and monetizing games.

Enjin Coin price outlook has shifted to neutral. It is on the verge of completing a high probability bottoming pattern, showing a positive divergence from some of the other cryptocurrencies that have printed new correction lows over the last couple of days.
Enjin Coin price has impressive short term potential if technicals align
Bottoms are rarely straightforward, and this will not be any different for ENJ as the Intotheblock In/Out of the Money Around Price data shows a big cluster of resistance from $2.81 to $2.89, which sits at the neckline of the potential head-and-shoulders bottom. A total of 154 addresses bought 82.55 million in that range.
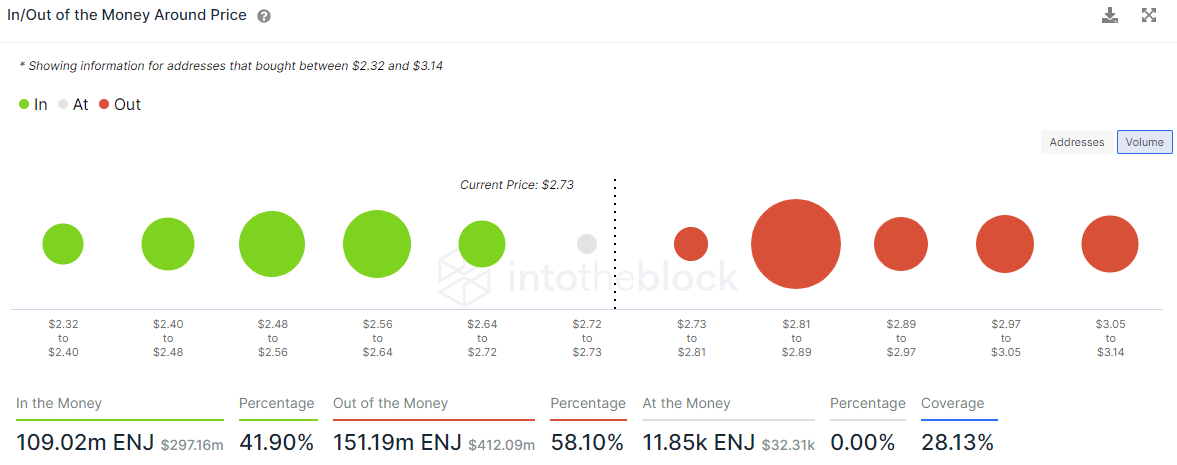
ENJ IOMAP data
On the 4-hour chart, ENJ is close to completing a head-and-shoulders bottom with the neckline trigger at $2.85. Resistance will quickly emerge at the declining trend line at $2.92, but a successful break out will expose the altcoin to a quick rally to the 50% retracement of the April decline at $3.29, where it coincides with some price congestion created last week.
The approximate next target is the 78.6% retracement at $3.60, representing just over a 26% gain from the neckline. Depending on the impulsiveness of the rally, ENJ could reach the all-time high at $4.02. If it successfully prints a new high, market participants need to watch the daily Relative Strength Index (RSI) for confirmation.
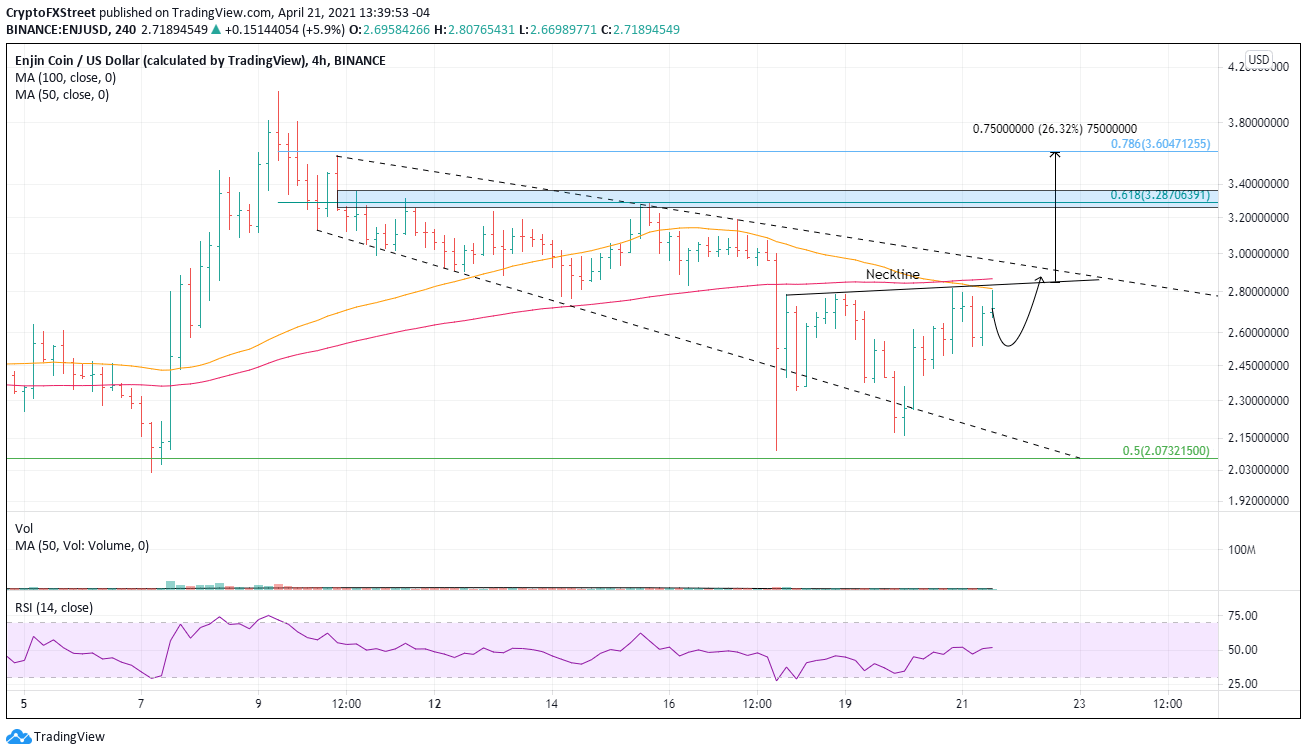
ENJ/USD 4-hour chart
ENJ support emerges at the 50-day simple moving average (SMA) at $2.38 and then the 50% retracement of the 2021 rally at $2.07. Selling pressure will find the March low at $1.91 a challenge. There is an outside possibility that ENJ reaches the 61.8% retracement at $1.61.
Author

Sheldon McIntyre, CMT
Independent Analyst
Sheldon has 24 years of investment experience holding various positions in companies based in the United States and Chile. His core competencies include BRIC and G-10 equity markets, swing and position trading and technical analysis.


