Elrond Technical Analysis: EGLD 250% rally seems unstoppable despite technicals spelling doom
- Elrond rally seems unbothered by the dwindling technical signals, perhaps due to the golden cross formation.
- Multiple sell signals are like to come into the picture in the coming sessions; hence the bullish outlook is in jeopardy.

Elrond has continued to rally despite the sluggish price action among altcoins in the top 100. The token is up over 250% from the lows traded in October and November. The first two weeks of December have been extremely successful for EGLD. However, according to technical levels, the rally is in jeopardy and could stall anytime.
Multiple sell signals could cut short the massive rally amid the fear of missing out (FOMO) and perhaps speculation for gains above the yearly high at $33. The sell signals on several charts suggest that a reversal is imminent. For now, Elrond is trading at $24 after spiking in successive bullish candles.
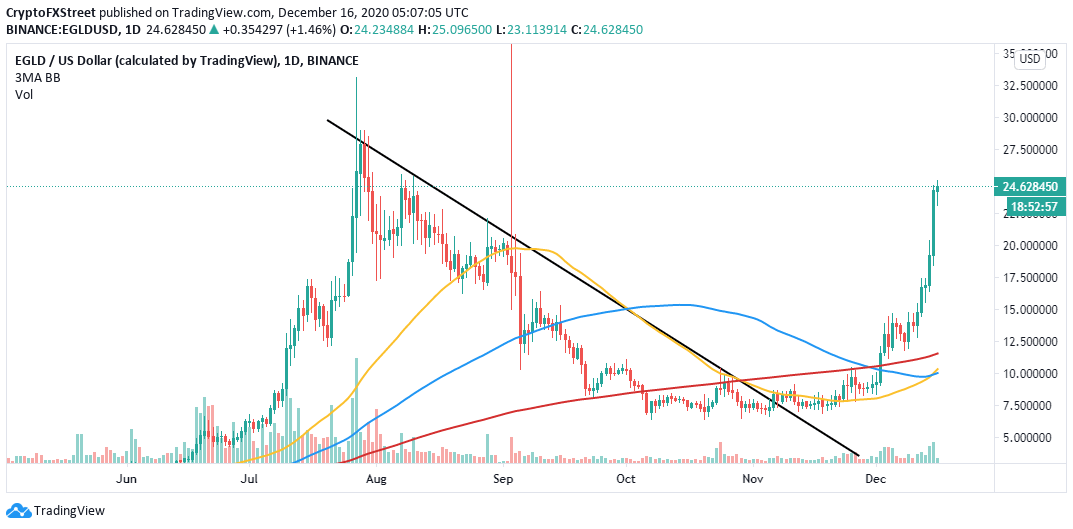
Elrond’s initial recovery phases occurred on account of a golden cross formed within its daily chart. The technical pattern developed the moment the 50-day moving average crossed above the 100-day moving average. Some of the most prominent technical analysts in the industry use this pattern as one of the most precise buy signals that could kick a bull run.
EGLD/USD 4-hour chart
The bullish outlook is likely in trouble after the TD Sequential presented multiple sell signals on different charts. Moreover, more sell signals would be exhibited in the coming sessions, especially on the 4-hour and daily charts.

EGLD/USD 4-hour/12-hour/daily charts
The bearish outlook has manifested or will manifest in green nine candlesticks. If validated, the calls to sell may lead to extensive losses, probably send EGLD back to the drawing board at $6 (November low).
Author

John Isige
FXStreet
John Isige is a seasoned cryptocurrency journalist and markets analyst committed to delivering high-quality, actionable insights tailored to traders, investors, and crypto enthusiasts. He enjoys deep dives into emerging Web3 tren


